
Blog
Vibe-Coding a Hitster Clone on a Highway
07 April 2026
Hitster is a music quiz card game you play with your phone: scan a QR code, Spotify plays the song, everyone guesses the year and sorts cards into a timeline. Simple, addictive, and about 25€ for a card deck. I figured I could build my own version using my personal Spotify playlists.
I built this DIY clone in about 3-4 hours — as a passenger on the drive home from Austria to Germany. No laptop. Just my phone, voice messages to Claude Code via Telegram, and a home server doing the work. Claude wrote the code, served it via Tailscale, and I checked the result on my phone. This post is about what I learned along the way.
The Setup
I didn’t pick any libraries or research auth flows beforehand. I just told Claude what I wanted to build, and it chose a simple vanilla stack: HTML, CSS, JavaScript, Spotify’s PKCE auth flow (no backend needed), QRCode.js for code generation, and Html5-QRCode for scanning.
After about three hours of driving, we stopped at a Burger King. While eating my burger, I scanned a QR code for the first time — and Spotify started playing.
What Worked Well
Spotify auth just worked. Claude told me to create a Developer account, register an app, and grab the Client ID. I did those steps on my phone, handed the Client ID back, and Claude implemented the entire login flow. After a couple of iterations — including figuring out that I needed to add myself as a test user — login worked. My only contribution was navigating the Spotify Developer Console.
Remote debugging without DevTools. Testing on Android Chrome meant no debug console. I could only describe symptoms — "the button doesn’t do anything" or "I see a white screen." The game-changer was asking Claude to add client-side error reporting: all JavaScript errors and console logs were sent back to the server, so Claude could see them directly. From that point on, debugging was almost as fast as having DevTools open — except I never had to look at a single error message myself.
Tailscale for mobile testing. I asked Claude to make the app accessible on my tailnet. It figured out the right command (tailscale serve --bg --https=8443 http://127.0.0.1:8080) and ran it. No port forwarding, no firewall rules — and I didn’t have to look up how Tailscale Serve works.
UI design via frontend design skill. UI is often the hard part for developers — getting something consistent and visually pleasant. Claude’s frontend design skill turned the rough initial interface into something that actually looked good, automatically. No design skills required on my end.
Where Things Went Wrong
The Spotify API silently broke. Despite correct auth and scopes, the playlist endpoint returned 403 Forbidden. Claude worked through it using the error logs from the browser and eventually figured out that Spotify had changed their API in February 2026: /v1/playlists/{id}/tracks was replaced by /v1/playlists/{id}/items. A two-line fix — but it took several iterations to get there. I never looked at the Spotify API docs myself; the AI diagnosed and fixed it autonomously.
The legal surprise. Everything came together so quickly that the app was nearly finished — which made me wonder: why hadn’t I found a single Spotify-integrated clone during my initial research? I asked Claude, and it came back with the answer immediately. Spotify’s Developer Policy, Section III, states plainly:
Do not create a game, including trivia quizzes.
That’s unambiguous. The game concept itself isn’t protected — but using the Spotify API to power it is explicitly forbidden. This is why there’s no popular public Hitster clone. Not because it’s technically hard, but because Spotify’s ToS prohibit it. Hitster itself likely has a special licensing agreement.
For private use with friends? No problem. As a product? Don’t even think about it. But thanks to vibe-coding, the investment was just a few hours of talking into my phone — and what I learned about the workflow was well worth it regardless.
The Workflow
The key was combining a few things: voice messages via Telegram to talk to Claude Code, Tailscale for instant preview on my phone, and --dangerously-skip-permissions so Claude could execute file writes and shell commands without confirmation. That last flag is essential for a voice-only workflow — you can’t approve every action from the passenger seat.
Voice in, code out, reload on phone. That loop turned a car ride into a coding session.
What’s Next
One gap remains: debugging. The client-side error reporting workaround works, but Chrome’s remote debugging via DevTools Protocol could give Claude direct access to console output and network requests from my phone’s browser — no workaround needed.
And since Spotify’s ToS prevent this particular project from going public, I’m brainstorming with Claude on a game idea that can actually ship — to vibe-code the full journey from idea to production.
The Bottom Line
Vibe-coding a mobile web app from your phone — without ever opening a laptop — works. Voice messages, an AI coding agent on a home server, and Tailscale for instant preview. The result is a fully working Hitster clone, ready for game night.
Built in April 2026, from the passenger seat on the A8 somewhere between Salzburg and Paderborn.
Window decoration for IntelliJ Idea in WSL
29 June 2025
You can thank me later but first go to Help → Edit custom VM Options.. and add:
# custom IntelliJ IDEA VM options (expand/override 'bin/idea64.vmoptions')
-Dawt.toolkit.name=WLToolkit
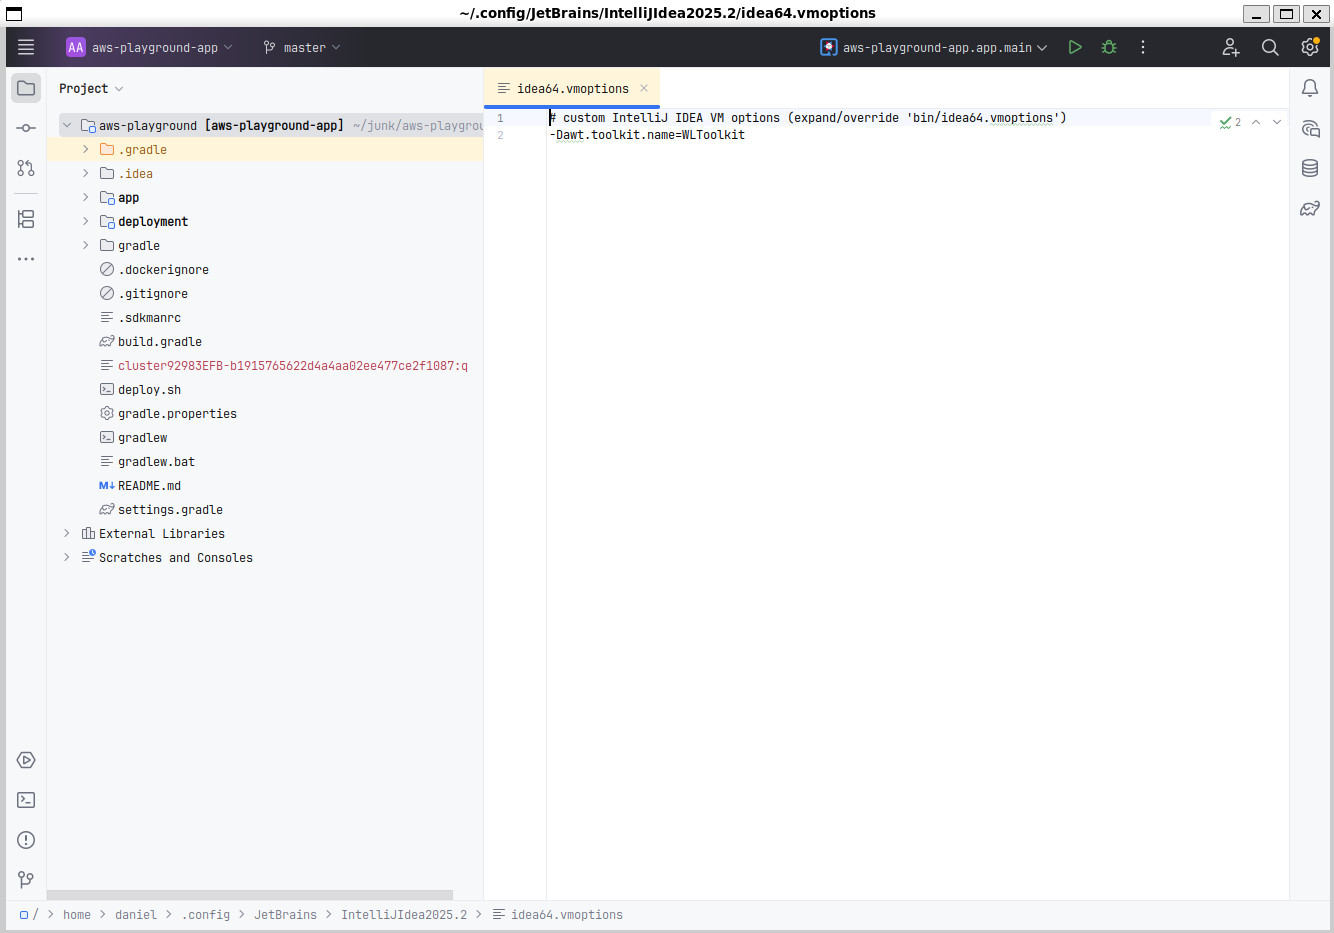
Figure 1. Before; showing ugly WSL window decoration
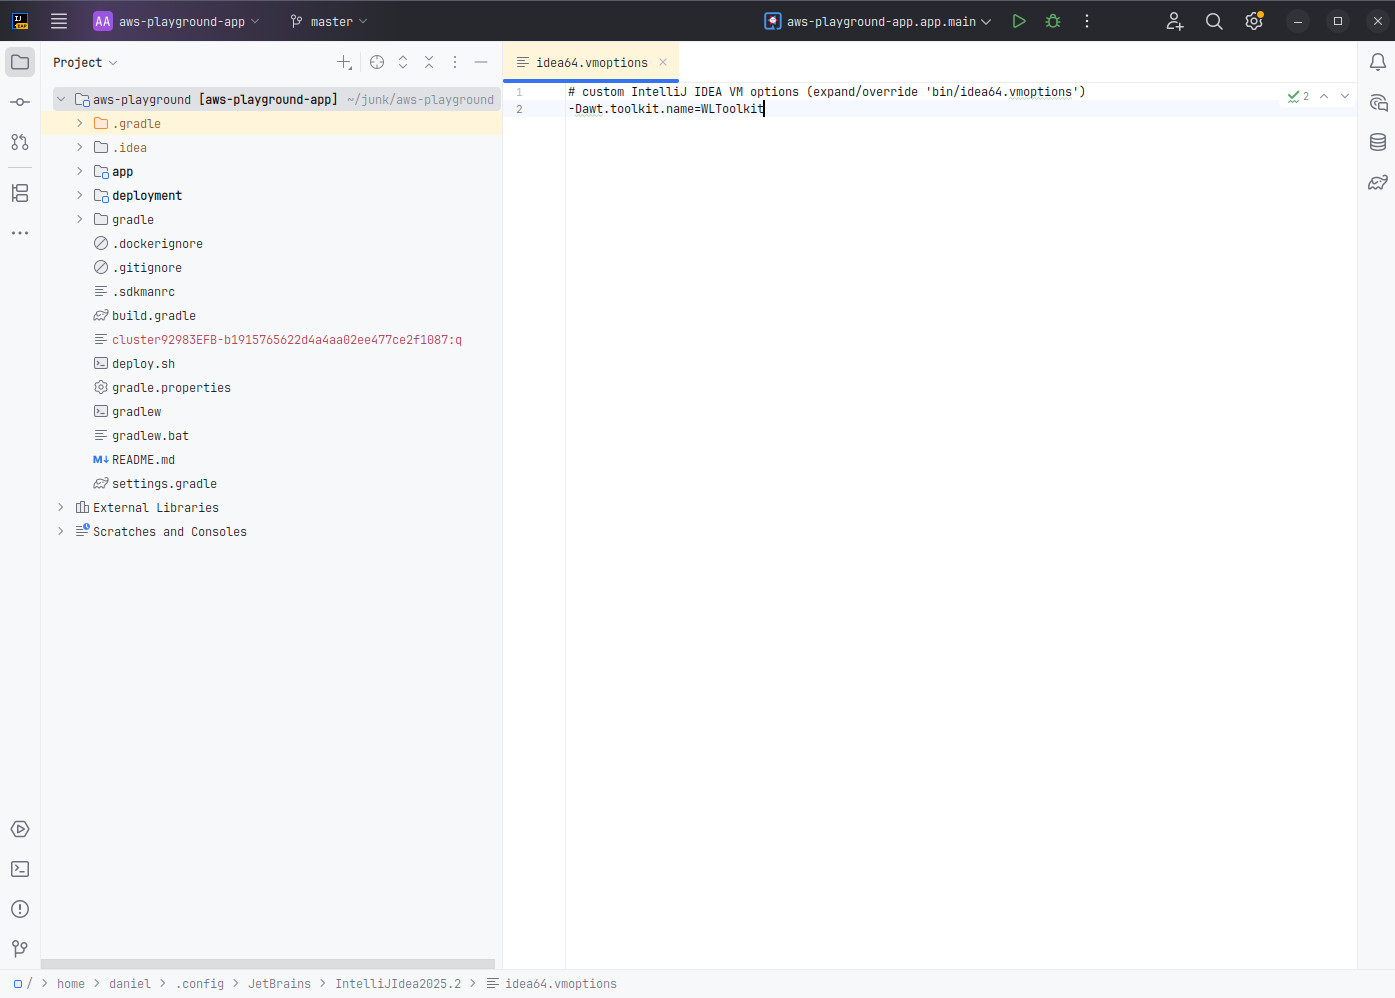
Figure 2. After; looks like Idea running natively under Windows
The issue on the Jetbrains issue-tracker is this.
Running a local LLM on Ollama and LangChain4J
01 January 2024
When working on my personal projects, I see myself quiet often reaching out to ChatGPT for a quick explaination or tip. Unfortunately, this is not possible/allowed in most corporate environments. That’s why I was naturally very interested in what it takes to run a Large Language Model (LLM) locally on my machine and maybe even enrich it with some domain knowledge and see if it can help in my daytime job for some use-case (either by fine-tuning wich is harder or by retrieval augmented generation (RAG)).
The AI journey for me just started, that’s why the goal of this post is to show how easy it is to run an LLM locally and access it from a Java-based application leveraging LangChain4J. As everyone has some favorite tools in his belt, it is natural to use them. That’s why my code example below is a self-contained JBang script that is leverarging Quarkus and it’s LangChain4J extension. You can just as easily cut Quarkus out of the picture and use LangChain4J directly, but I was especially interested in the state of the Quarkus Integration for LangChain4J.
So, as you might have understood by now, LangChain4J is a big part of what allows you to access an LLM. What is important to understand here, is that it is only an abstraction to program against different AI services. LangChain4J does not actually run/host an LLM. For that we will need another service that runs the LLM and exposes it so LangChain4J can access it. As a matter of fact, LangChain4J can integrate with OpenAI’s GPT models as they expose a Restful API for it. In a similar fashion we can run an LLM locally with Ollama and configure the exposed Restful endpoint for LangChain4J to use. As this is just the beginning of the journey for me, I cannot explain to you what it would take to run/host an LLM in Java natively. For sure it must be technically possible, but then again, what is the big benefit?
Installing Ollama
So, first step is to install Ollama. I ran it under WSL on a Windows machine and the steps you can find here are as simple as they get:
curl https://ollama.ai/install.sh | sh
After this you need to download a model and then can interact with it via the commandline. If you have an already rather old Graphics cards like an NVidia RTX 2060 (with 6 GB VRAM), you can run a mid-sized model like Mistral 7b without problems on your GPU alone.
Run ollama run mistral which will download the model and then start a prompt to interact with it. The download is 4 GB, so it might take a few minutes depending on your internet speed.
If you feel like your PC is not capable of running this model, maybe try orca-mini instead and run ollama run orca-mini:3b.
Generally, the models should be capable to run on a compatible GPU or fall back to running on the CPU. In case of running on the CPU, you will need a corresponding amount of RAM to load it.
Ollama will install as a service and expose a Restful API on port 11434. So, instead of using the command prompt you can also try to hit it via curl for a first test:
curl -i -X POST http://127.0.0.1:11434/api/generate -d '{"model": "mistral", "prompt": "Why is the sky blue?"}'
Note that you have to provide your model that you download before as the model parameter.
Quarkus and Langchain4J
If this is working we can come to the next step and use the LLM from within our Java application. For that, we need the LangChain4J library which can talk to our Ollama service. Also, as I am a big fan of JBang and Quarkus, these were my natural choice for integrating with LangChain4J. But you can just as well use Langchain4J directly without any framework. See this test for the most basic integration between Langchain4J and Ollama.
Now lets come to this self-contained JBang script that will interact with the Ollama-based LLM:
///usr/bin/env jbang "$0" "$@" ; exit $?
//DEPS io.quarkus.platform:quarkus-bom:3.6.4@pom
//DEPS io.quarkus:quarkus-picocli
//DEPS io.quarkus:quarkus-arc
//DEPS io.quarkiverse.langchain4j:quarkus-langchain4j-ollama:0.5.1 (1)

//JAVAC_OPTIONS -parameters
//JAVA_OPTIONS -Djava.util.logging.manager=org.jboss.logmanager.LogManager

//Q:CONFIG quarkus.banner.enabled=false
//Q:CONFIG quarkus.log.level=WARN
//Q:CONFIG quarkus.log.category."dev.langchain4j".level=DEBUG
//Q:CONFIG quarkus.langchain4j.ollama.chat-model.model-id=mistral (2)

import static java.lang.System.out;

import com.fasterxml.jackson.annotation.JsonCreator;

import dev.langchain4j.service.SystemMessage;
import dev.langchain4j.service.UserMessage;
import io.quarkiverse.langchain4j.RegisterAiService;
import jakarta.enterprise.context.control.ActivateRequestContext;
import jakarta.inject.Inject;
import picocli.CommandLine;

@CommandLine.Command
public class QuarkusLangchainOllama implements Runnable {

    @Inject
    TriageService triage;

    @Override
    @ActivateRequestContext (3)
    public void run() {
        String review = "I really love this bank. Not!";
        out.println("Review: " + review);
        out.println("...");
        TriagedReview result = triage.triage(review);

        out.println("Sentiment: " + result.evaluation());
        out.println("Message: " + result.message());
    }
}

@RegisterAiService
interface TriageService {
    @SystemMessage("""
        You are working for a bank, processing reviews about
        financial products. Triage reviews into positive and
        negative ones, responding with a JSON document.
        """
    )
    @UserMessage("""
        Your task is to process the review delimited by ---.
        Apply sentiment analysis to the review to determine
        if it is positive or negative, considering various languages.

        For example:
        - `I love your bank, you are the best!` is a 'POSITIVE' review
        - `J'adore votre banque` is a 'POSITIVE' review
        - `I hate your bank, you are the worst!` is a 'NEGATIVE' review

        Respond with a JSON document containing:
        - the 'evaluation' key set to 'POSITIVE' if the review is
        positive, 'NEGATIVE' otherwise
        - the 'message' key set to a message thanking or apologizing
        to the customer. These messages must be polite and match the
        review's language.

        ---
        {review}
        ---
    """)
    TriagedReview triage(String review);
}

record TriagedReview(Evaluation evaluation, String message) {
    @JsonCreator
    public TriagedReview {}
}

enum Evaluation {
    POSITIVE,
    NEGATIVE
}-
The required dependency to interact with Ollama.
-
The model needs to be configured as this is needed for the
modelparameter in the Restful request to Ollama. -
Without this, I got an error that RequestScope is not initalized. But the error-message from Quarkus was very helpful and directly gave me the solution.
You can find the source-code/the JBang script here.
I don’t want to explain the main code that much as I just took the example from this awesome LangChain4J post by the Quarkus guys and you can read about it over there, but I think there is one quiet awesome fact that needs to be pointed out about it:
In the prompt we are telling the LLM to return a JSON structure with specific key names. Based on this, we are setting up our JSON-serializable POJOs named TriageReview and Evaluation.
In case the LLM returns a correct JSON structure (which the Mistral model did for me), Quarkus can deserialize it into an instance of TriagedReview. So, even though LLMs are widely seen as chat bots and usally return human-readable text, it is not limited to this.
There is no need to do any kind of manual parsing of the responses. As it is directly returning JSON, it is just as if you were calling an Restful endpoint via an OpenAI specification.
As I was saying before, LangChain4J offers an abstraction over different AI services. You could have skipped the setup of Ollama completly and just tried it out with OpenAI’s GPT-3 or GPT-4. The main difference would have just been to change the dependency from io.quarkiverse.langchain4j:quarkus-langchain4j-ollama:0.5.1 to io.quarkiverse.langchain4j:quarkus-langchain4j-openai:0.5.1.
The last thing to do is to run the script via the JBang CLI. It should rate the sentiment of the given comment as negative in case it works as expected.
jbang run --quiet QuarkusLangchainOllama.java
Have fun with it.
Ramblings in AI
21 November 2023
As I am progressing with my learnings in AI, I wanted to have a way to keep a diary. Though JBake is great for my main Java-based blog, it is not perfect for documenting in the Python realm. Here, Jupyter notebooks are king. For that reason, I set up a seperate page to document my ramblings in Python and AI under https://dplatz.de/aiblog/).
Deploying a Quarkus application using sticky sessions to AWS EKS using AWS CDK
17 September 2023
JSF applications rely on sticky sessions. This means, the server-side JVM maintains state (usally in memory) for a particular user/client. For this, each request needs to be routed to the same JVM; in Kubernetes language: to the same pod. The relation between client and server is achieved by sending a session-cookie to the browser. The browser sends this cookie to the server in every request. Now the infrastructure in between needs to be set up so it recognizes this cookie (it needs to be aware about this cookie / the name of the cookie) and routes / pins the request appropriately to the same pod.
I wanted to see how exactly this needs to be set up in the context of AWS Elastic Kubernetes Service (EKS). For that I created this Github repository. It uses AWS' Java CDK to deploy the infrastructure (Elastic Container Registry, Elastic Kubernetes Service) and then deploys a simple Quarkus application that helped me verify the correct handling of the cookie / the stickyness.
The only step to run is ./deploy.sh all. This will provision the AWS infrastructure and then deploy the application assuming you have used AWS on your system before and have valid AWS credentials configured.
Running kubectl get pods -o wide you should see that because we have provisioned two EC2 nodes as part of the Kubernetes cluster that the pods are running on different nodes.
The output of the deploy.sh should have given you the public endpoint that was provisioned (Access @ http://<aws-public-endpoint>/hello should have been printed). Accessing this endpoing will print all environment variables of the pod. If you run http://<aws-public-endpoint>/hello?var=HOSTNAME it will print only the hostname of the pod. You should see that on each request you get a different pod due to the load balancer.
If you access http://<aws-public-endpoint>/hello/session instead, you should see that it should connect to the same pod each time because a cookie gets used.
The cookie name that is created in the code (https://github.com/38leinaD/aws-playground/blob/master/app/src/main/java/de/dplatz/TestResource.java#L29) needs to match the configuration of the Application Loadbalancer (ALB) in the ingress configuration (https://github.com/38leinaD/aws-playground/blob/master/deployment/k8s/services.yaml#L65; see stickiness.app_cookie.cookie_name=mycookie).
Please note that for the ingress to work properly, the ALB controller needs to be configured as part of provisioning the EKS cluster:
Cluster eksCluster = Cluster.Builder.create(this,"eks-cluster")
        .vpc(vpc)
        .vpcSubnets(List.of(
                SubnetSelection.builder().subnetType(SubnetType.PUBLIC).build(),
                SubnetSelection.builder().subnetType(SubnetType.PUBLIC).build(),
                SubnetSelection.builder().subnetType(SubnetType.PUBLIC).build()))
        .defaultCapacity(2)
        .defaultCapacityInstance(InstanceType.of(InstanceClass.T3, InstanceSize.SMALL))
        .defaultCapacityType(DefaultCapacityType.EC2)
        .mastersRole(clusterAdminRole)
        .albController(AlbControllerOptions.builder() (1)
                .version(AlbControllerVersion.V2_5_1)
                .build())
.version(KubernetesVersion.V1_27).build();-
ALB controller required by the ingress
See here for the full CDK stack.
Don’t forget to run ./deploy.sh destroy at the end to shut everything down again.
Minimalist Webstandards with rollup.js
16 October 2022
I have been a long-time fan of what once was called Pika and now is called Snowpack.
Basically, it was the revolution how JavaScript web-apps are built. Instead of requiring a custom dev-server and doing a lot of "bundler magic" behind the scenes (basically every framework out there like Angular, Vue, etc. using Webpack), it just processed the Node dependencies and converted them into standard ES6 modules. What you could do now is reference this standard ES6 modules from your App without the need of a special build step on your application or custom dev-server. Modern browser can process imports like import { html, LitElement } from './lib/lit-element.js';. Just copy your HTML, standard/vanilla JS on a plain web-server (or use a generic tool like browser-sync) and way you go. You can read more about the general approach in one of my previous posts.
To me this approach always felt very natural, intuitive and did not introduce too much dependency on complex tools that lock you in. With Snowpack 3, I am getting the same vibe now like previously with Webpack. It has become a complex tool (includes bundeling, minification, etc.) that requires you to now use it’s own dev-server.
For this reason, I have now moved back to a lower-level tool which is called rollup.js. With rollup.js, we can convert Node dependency into standard ES6 modules. Nothing more and nothing less. You can find the full example project on GitHub.
The main parts are the package.json with dependecy to rollup and the webDependencies section that I have kept analogous to how Pika/Snowpack have it:
{
  "name": "webstandards-starter",
  "version": "1.0.0",
  "description": "Starter project for web-development using the web's latest standards.",
  "main": "src/AppMain.js",
  "scripts": {
    "postinstall": "rollup -c", (1)
    "start": "browser-sync src -f src --single --cors --no-notify --single"
  },
  "repository": {
    "type": "git",
    "url": "git+https://github.com/38leinaD/webstandards-starter.git"
  },
  "author": "",
  "license": "ISC",
  "bugs": {
    "url": "https://github.com/38leinaD/webstandards-starter/issues"
  },
  "homepage": "https://github.com/38leinaD/webstandards-starter#readme",
  "devDependencies": {
    "browser-sync": "^2.27.10",
    "rollup": "^3.2.1", (2)
    "@rollup/plugin-node-resolve": "^15.0.0"
  },
  "dependencies": {
    "@vaadin/router": "^1.7.4",
    "lit-element": "^3.2.2"
  },
  "rollup": {
    "webDependencies": [ (3)
      "@vaadin/router/dist/vaadin-router.js",
      "lit-element/lit-element.js",
      "lit-html/directives/async-append.js",
      "lit-html/directives/async-replace.js",
      "lit-html/directives/cache.js",
      "lit-html/directives/class-map.js",
      "lit-html/directives/guard.js",
      "lit-html/directives/if-defined.js",
      "lit-html/directives/repeat.js",
      "lit-html/directives/style-map.js",
      "lit-html/directives/unsafe-html.js",
      "lit-html/directives/until.js"
    ]
  }
}-
postinstallruns rollup when executingnpm install -
devDependency to rollup and rollup plugin
-
Similar
webDependenciesconfiguration as known from Pika/Snowpack
You can see that I added a postinstall step executing rollup -c. What this will do is call rollup on npm install and use the rollup.config.mjs file which looks like this:
import { nodeResolve} from '@rollup/plugin-node-resolve';
import * as fs from 'fs';
import * as path from 'path';

function outDir(relPath) {
  const nodeModulesPath = `./node_modules/${relPath}`
  const parentDir = path.dirname(relPath)

  // Just some basic logic how to generated output-paths under src/lib
  if (`${path.basename(parentDir)}.js` === path.basename(relPath)) {
    // lit-element/lit-element.js is simplified to 'src/lib/lit-element.js'
    return path.dirname(parentDir)
  }
  else {
    return path.dirname(relPath)
  }
}

export default JSON.parse(fs.readFileSync('package.json', 'utf8')).rollup.webDependencies.map(relPath => {
  console.log("Processing:", relPath)

  const nodeModulesPath = `./node_modules/${relPath}`

  return {
    input: [
      nodeModulesPath
    ],
    output: {
      dir: 'src/lib/' + outDir(relPath),
      format: 'esm',
    },
    plugins: [nodeResolve({
      browser: true
    })]
  };
});
What this does is the bare minimum of what Pika and Snowpack are also doing: Process each of the elements in webDependencies and convert the dependency into a standard ES6 module. The ES6 module is created under src/lib and allows for easy referencing via import from the application. After running the install-step, you can copy the app to any standard web-server; or use browser-sync for that matter.
I am not saying that this is the way to go for bigger commerical projects, but to me this makes for a simple and understandable setup that at least serves me well for learning purposes and personal projects. Eventually, most libraries/dependencies will come out of the box as modules and the rollup step can be eliminated completely.
AWS RDS with IAM Auth
06 August 2022
When looking up things in the offical AWS Docs, code examples often still refer to AWS SDK version 1. Whereas the latest version of the SDK is version 2 and completly different API-wise. Same so the other day when I needed to find out how to generate an IAM token to access the AWS RDS Aurora database.
Digging through a Github issue and a pull-request lead me to the solution:
import software.amazon.awssdk.auth.credentials.DefaultCredentialsProvider;
import software.amazon.awssdk.regions.Region;
import software.amazon.awssdk.services.rds.RdsUtilities;
import software.amazon.awssdk.services.rds.model.GenerateAuthenticationTokenRequest;

public class IamTokenGenerator {

    public static String retrieveIamToken(String hostname, int port, String username) {
        RdsUtilities rdsUtilities = RdsUtilities.builder()
                .credentialsProvider(DefaultCredentialsProvider.create())
                .region(Region.EU_CENTRAL_1)
                .build();
        GenerateAuthenticationTokenRequest tokenRequest = GenerateAuthenticationTokenRequest.builder()
                .credentialsProvider(DefaultCredentialsProvider.create())
                .region(Region.EU_CENTRAL_1)
                .hostname(hostname)
                .port(port)
                .username(username)
                .build();
        return rdsUtilities.generateAuthenticationToken(tokenRequest);
    }
}
The following dependency is needed (RdsUtilities was only introduced in 2.16.3!):
implementation 'software.amazon.awssdk:rds:2.16.3'
Maybe this can save someone a few minutes.
Quarkus - OIDC - Offering a Login button
02 April 2021
Quarkus offers an integration with OpenIdConnect (OIDC). This means, you can use indentity providers like Keycloak, ForgeRock or AWS Cognito to delegate your authentication needs. With Keycloak, you can also have identity brokering with other identity providers. This means, people can sign up with your application/service via Keycloak directly or people can also select an option like "Login with GitHub".
For the general usage of OIDC with Quarkus, please refer to this guide. My post is about the specific need of offering a Login-button in your application; which I would have thought to be an out of the box feature. Don’t get me wrong; this is not hard to achieve, but also not trivial and well documented.
My general setup is a Quarkus application with server-side-rendered Web frontend. This may be JSF (the Quarkus Universe offers a MyFaces extension), but for me it was using the more lightweight Qute template library; which feels more like Spring MVC with Thymeleaf.
Problem Statement
So, what exactly do we want? If a user is not logged in, there should be a Login-button. Once this button is pressed, the user should be redirected to the identity provider’s login page. Once the login is done, I would like to redirect the user to same URL he was coming from. I.e. the user might be browsing a specific page or product in the catalog and decides to log in.
The thing with offering a login button is that there is no URL to the login page. The redirects to the identity provider happen in Quarkus internally by intercepting the requests and checking if a URL is protected or not. If a URL is protected and there is not valid Access Token already exchanged, the login is triggered. Also, in my case, most pages are not really protected but can be accessed by a unauthenticated as well as by a logged in user. The difference is just what actions are possible on the page.
This is the basic configuration for OIDC with Keycloak as my identity provider. You see, that quarkus.http.auth.permission.permit1 gives full access all URLs also users that are not logged in.
quarkus.oidc.enabled=true
quarkus.oidc.auth-server-url=http://localhost:8180/auth/realms/quarkus
quarkus.oidc.client-id=frontend
quarkus.oidc.application-type=web_app
quarkus.oidc.logout.path=/logout
quarkus.oidc.logout.post-logout-path=/
quarkus.oidc.token.refresh-expired=true
quarkus.oidc.authentication.session-age-extension=30M

quarkus.http.auth.permission.permit1.paths=/*
quarkus.http.auth.permission.permit1.policy=permit
quarkus.http.auth.permission.permit1.methods=GET,POST
Solution
The way to offer a login button is by registering a URL/endpoint that is actually protected:
quarkus.http.auth.permission.authenticated.paths=/login
quarkus.http.auth.permission.authenticated.policy=authenticated
This URL is not provided by Quarkus but needs to be provided by ourselfs:
@Path("/")
public class IndexResource {

    // Other methods...

    @GET
    @Path("login")
    public Response login(@QueryParam("redirect") String redirect) {
        return Response.temporaryRedirect(URI.create(redirect)).build();
    }
}
On my HTML page (Qute template), I offer a login button like this:
<a class="button is-light" href="javascript:location.href='/login?redirect=' + encodeURIComponent(location.href)">
    Login
</a>
How exactly does this work when the user presses the Login button?
The Login button will send a GET request for the page /login?redirect=…. The GET request contains a redirect=… query parameter with the URL of the currently open page. The redirect is so after the login we can get back to this page.
Quarkus will notice from the config quarkus.http.auth.permission.permit1 that /login is protected. If the user is not logged in, we will be redirected to the Keycloak login page. Once the login is done, Keycloak will redirect to the /login page. This will invoke our IndexResource.login method, where we will again redirect to the redirect parameter URL; bringing us back to the initial page the user pressed the Login button on. He is now logged in.
I hope the process is clear and it helps others to implement the same flow. To me, it looked like this is not very well documented and it felt to me like I had to come up with this solution myself and get confirmation that this was indeed the right approach.
AWS CDK & JBang
01 March 2021
I am a big of AWS and the services it offers. What I am not a big fan of, is CloudFormation; in the sense that I don’t like to write huge YAML files to define my AWS resources. An alternative approach is to use a tool like Ansible, where learning it, at least can be used also for other Cloud providers like Azure. But still, as a Java Developer, I don’t feel comforable writing extensive/large YAML or JSON files.
Meet the AWS Cloud Development Kit (CDK), which essentially allows you to define your AWS resources by writing Java code.
CDK comes with a Node-based commandline, so you will first have to install Node 10+; now, install the aws-cdk CLI tool:
sudo npm install -g aws-cdk
Maven
What you could be doing now, is scaffold a Maven project and use it to define your recourses in Java code. Within an empty directory for your project run:
cdk init app --language=java
You can now import this into your IDE of choice, define resource in Java and then deploy it using cdk deploy assuming you have a default profile for AWS set up on your system/user (check ~/.aws/credentials).
This is already quiet nice and I can recommand you to have a look at the Video series by rickpil and the great CDK API reference.
JBang
What is even cooler, is that we can use it with JBang as well.
If you take a look at the Maven project, it is just a regular project without any specific plugins. The only thing that makes it work and ties it to the cdk CLI tool, is the cdk.json in the root folder. It contains an app parameter which gives it a command to run the application (mvn -e -q compile exec:java). Actually, what is happening, is that the Java application will produce a CloudFormation template, which is than feed to AWS.
So, what we need for a minimalist AWS deployment script using JBang, is the below two files only.
awsdeployment.java
///usr/bin/env jbang "$0" "$@" ; exit $?
//DEPS software.amazon.awscdk:core:1.91.0
//DEPS software.amazon.awscdk:s3:1.91.0

import software.amazon.awscdk.core.App;
import software.amazon.awscdk.core.Construct;
import software.amazon.awscdk.core.Stack;
import software.amazon.awscdk.core.StackProps;
import software.amazon.awscdk.services.s3.Bucket;

import static java.lang.System.*;
import java.util.Arrays;

public class awsdeployment extends Stack {
    public static void main(final String[] args) {
        App app = new App();

        new awsdeployment(app, "AwsCdkTestStack");

        app.synth();
    }

    public awsdeployment(final Construct scope, final String id) {
        this(scope, id, null);
    }

    public awsdeployment(final Construct scope, final String id, final StackProps props) {
        super(scope, id, props);

        // Create an S3 bucket
        new Bucket(this, "MyBucket");

        // Create other resources...
    }
}
cdk.json
{
  "app": "jbang awsdeployment.java",
  "context": {
    "@aws-cdk/core:enableStackNameDuplicates": "true",
    "aws-cdk:enableDiffNoFail": "true",
    "@aws-cdk/core:stackRelativeExports": "true",
    "@aws-cdk/aws-ecr-assets:dockerIgnoreSupport": true,
    "@aws-cdk/aws-secretsmanager:parseOwnedSecretName": true,
    "@aws-cdk/aws-kms:defaultKeyPolicies": true,
    "@aws-cdk/aws-s3:grantWriteWithoutAcl": true
  }
}
When you run cdk deploy, it should deploy an S3 bucket named "MyBucket" to AWS.
Firestarter - A fireplace with JBang and Quarkus
17 February 2021
My dad built us a "fake fireplace" as decoration some time ago. Actually, it was a gift for my wife’s birthday. After beeing placed in the hall for some time, it finally found the perfect spot in our living room. With its new spot also came a power outlet right behind it. We thought it would be nice if the fireplace actually would be even "more fake"; so I got a spare Monitor, a Raspberry Pi and added a few lines of Java using Quarkus and JBang.
Firestarter is the final result. Essentially, it opens a browser in fullscreen and plays whichever YouTube clip you have configured. As I do not want to ask my wife to connect to the Raspberry Pi via SSH to change the clip, I added a small web-interface that can be easily opened on the phone.
Installation
First, check via java -version if you have JDK 11 installed on the Raspberry Pi. If not, run
sudo apt install default-jdk
The simplest way to use Firestarter (which uses JBang) on the Raspberry Pi is via the zero-installation approach:
curl -Ls https://sh.jbang.dev | bash -s - firestarter@38leinaD
Autostart
If you would like to have Firestarter autostart after booting to the desktop, you just have to place below file in ~/.config/autostart/
firestarter.desktop
[Desktop Entry]
Type=Application
Name=firestarter
uomment=Starts the firestarter app on startup
Exec=/bin/bash -c "sleep 10 && curl -Ls https://sh.jbang.dev | bash -s - firestarter@38leinaD"
NotShowIn=GNOME;KDE;XFCE;
The sleep is just to wait a few seconds after boot so the Wifi is connected. Otherwise, the curl might fail. There are more reliable alternatives but it is good enough for me.
Move mouse
I had the problem that the mouse was placed on the taskbar after boot. That position is over the YouTube clip in Chrome later on and thus title and controls will stay visible.
To move the mouse out of the way, I used the answer to this stackoverflow question and removed @point-rpi from /home/pi/.config/lxsession/LXDE-pi/autostart.
Changing the Fireplace Video
Open http://pi.local:8080/firestarter (or whatever is the name/IP of your Raspberry Pi on the local network) from any Browser in your local network and paste the Url of a YouTube clip.
This one is especially nice if you are a fan of pixel-art: A Pixel Fireplace.
JBang Installation on Rasperry Pi
Just as a side-note: JBang is just a great tool for writing small scripts with Java. There are multiple ways to use/install JBang on the Raspberry Pi. One possibility is to install it via Snap. Unfortunately, it does not have the latest version of JBang currently (see here). So, firestarter will not work with the JBang version from Snap currently. Once the JBang version on Snap is updated, you could use it like this as well:
sudo snap install jbang --classic
jbang run firestarter@38leinaD
|
Note
|
Update: As of now, Snap hosts JBang 0.66.1 which is the latest version and is working with firestarter as well. |
Quarkus - StdOut to Log
14 November 2020
Quarkus uses JBoss Logging as it’s default logging implementation but you will not see System.out.println calls gettings routed to a logger.
From from JBoss/Wildfly, I am used to this and thus these calls end up in the log-file.
This is currently not done in Quarkus (see this issue.
If you enable logging to a file via quarkus.log.file.enable=true in your application.properties, you will not see these calls in your log-file.
Below is a simple class you can use to route all System.out.println calls in Quarkus to the logging system.
import java.io.OutputStream;
import java.io.PrintStream;

import org.jboss.logging.Logger;
import org.jboss.logging.Logger.Level;

public class JBossLoggingOutputStream extends OutputStream {
    private final Logger logger;
    private final Level level;
    private final StringBuffer buffer = new StringBuffer();

    public JBossLoggingOutputStream (Logger logger, Level level) {
        this.logger = logger;
        this.level = level;
    }

    public void write (int b) {
        byte[] bytes = new byte[1];
        bytes[0] = (byte) (b & 0xff);
        String str = new String(bytes);

        if (str.equals("\n")) {
            flush ();
        }
        else {
            buffer.append(str);
        }
    }

    public void flush () {
        logger.log (level, buffer);
        buffer.setLength(0);
    }

    public static PrintStream createPrintStream(Logger logger, Level level) {
        return new PrintStream(new JBossLoggingOutputStream(logger, level));
    }
}
You should activate this class early on in your application. For example, by observing the StartupEvent.
@ApplicationScoped
public class Startup {

    void onStart(@Observes StartupEvent ev) {
        System.setOut(JBossLoggingOutputStream.createPrintStream(Logger.getLogger("io.quarkus"), Level.INFO));
        System.out.println("Application started.")
    }
}
You should see that the text Application started is shown in the console output with proper timestamp and thread information. Also, it ends up in your log-file if you have configured it properly.
Access of Jars from Gradle cache
25 September 2020
There are times where you quickly need the path to a JAR-file from the Gradle cache. For Maven this is quiet straight-forward as the path of a file in the local Maven cache (~/.m2/repository) is determined alone by the GAV coordinates.
This is not the case for Gradle. Files are located under ~/.gradle/caches but the folder-names look like they are hash-values and the only way I know how to get the path of a JAR-file is by actually running a Gradle build-script that downloads and resolves the dependency.
For this reason, I now have a small shell-script that does it exactly that:
#!/bin/bash
# gradle-resolve.sh
tmp_dir=$(mktemp -d)
cat << EOF > $tmp_dir/build.gradle
plugins {
    id 'java'
}

repositories {
    jcenter()
}

dependencies {
    implementation "$2"
}

tasks.register("getClasspath") {
    doLast {
        println configurations.runtimeClasspath.join(':')
    }
}

tasks.register("getJar") {
    doLast {
        println configurations.runtimeClasspath[0]
    }
}
EOF

(cd $tmp_dir && gradle $1 --console=plain --quiet)
It can be invoked with getJar to get the path of the JAR in the Gradle cache:
gradle-resolve.sh getJar org.jboss:jandex:2.0.5.Final
/home/daniel/.gradle/caches/modules-2/files-2.1/org.jboss/jandex/2.0.5.Final/7060f67764565b9ee9d467e3ed0cb8a9c601b23a/jandex-2.0.5.Final.jar
Or it can be invoked with getClasspath to get the whole runtime-classpath.
gradle-resolve.sh getClasspath org.eclipse.jetty:jetty-server:9.4.29.v20200521
/home/daniel/.gradle/caches/modules-2/files-2.1/org.eclipse.jetty/jetty-server/9.4.29.v20200521/2c6590067589a0730223416c3157b1d4d121b95b/jetty-server-9.4.29.v20200521.jar:/home/daniel/.gradle/caches/modules-2/files-2.1/javax.servlet/javax.servlet-api/3.1.0/3cd63d075497751784b2fa84be59432f4905bf7c/javax.servlet-api-3.1.0.jar:/home/daniel/.gradle/caches/modules-2/files-2.1/org.eclipse.jetty/jetty-http/9.4.29.v20200521/21b761eae53b8e5201fb8fdf03b9865116a29b47/jetty-http-9.4.29.v20200521.jar:/home/daniel/.gradle/caches/modules-2/files-2.1/org.eclipse.jetty/jetty-io/9.4.29.v20200521/ffadd07dc4e9d0783531922ed565b667ad95766e/jetty-io-9.4.29.v20200521.jar:/home/daniel/.gradle/caches/modules-2/files-2.1/org.eclipse.jetty/jetty-util/9.4.29.v20200521/4866aa5271465f1d9035c4726209e4926fe1599c/jetty-util-9.4.29.v20200521.jar
So, to run the Main-Class from the jandex jar, you can execute:
java -jar $(gradle-resolve.sh getJar org.jboss:jandex:2.0.5.Final)
Quarkus - Custom CDI Scopes
11 September 2020
Quarkus provides no full CDI implementation and as such, no support for CDI extension. This is because CDI extensions are inherently runtime-based and thus do not fit into Quarkus' model of doing as much as possible during build-time. No support for CDI extensions also means no standard support for registration of custom CDI scopes.
Well, it sounds like quiet a limitation, but actually Arc (Quarkus' CDI implementation) provides an API to register custom scopes. And as you will see, implementing a custom scope is 99% the same as you know it from standard CDI.
In this post, I will show the code for a simple custom scope that that is local to the current thread; i.e. the context keeps track of thread-local state.
Annotation
The scope is called CallScoped and that is also the the name of the annotation:
@Documented
@NormalScope
@Inherited
@Retention(RetentionPolicy.RUNTIME)
@Target({ElementType.TYPE, ElementType.METHOD, ElementType.FIELD})
public @interface CallScoped {}
Context
The context-class, which contains the main login of any custom scope, I will not put here in it’s entirety but only describe what is different to a standard CDI context. You can find the CallScopeContext here.
public class CallScopeContext implements InjectableContext {

    static final ThreadLocal<Map<Contextual<?>, ContextInstanceHandle<?>>> ACTIVE_SCOPE_ON_THREAD = new ThreadLocal<>();

    //...
}
The context-class needs to implement InjectableContext which is Quarkus specific, but extends from the standard AlterableContext. So, there are only two additional methods to implement: destroy and getState. The first is to destroy the active scope entirely; and the second allows to capture and browse the state of the context. E.g. it enables this dev-mode feature.
@Override
public void destroy() {
    Map<Contextual<?>, ContextInstanceHandle<?>> context = ACTIVE_SCOPE_ON_THREAD.get();
    if (context == null) {
        throw new ContextNotActiveException();
    }
    context.values().forEach(ContextInstanceHandle::destroy);
}

@Override
public ContextState getState() {
    return new ContextState() {

        @Override
        public Map<InjectableBean<?>, Object> getContextualInstances() {
            Map<Contextual<?>, ContextInstanceHandle<?>> activeScope = ACTIVE_SCOPE_ON_THREAD.get();

            if (activeScope != null) {
                return activeScope.values().stream()
                        .collect(Collectors.toMap(ContextInstanceHandle::getBean, ContextInstanceHandle::get));
            }
            return Collections.emptyMap();
        }
    };
}
Registration
The registration of the custom scope and context happens during built-time in a @BuildStep.
public class ApplicationExtensionProcessor {

    @BuildStep
    public void transactionContext(
            BuildProducer<ContextRegistrarBuildItem> contextRegistry) {

        contextRegistry.produce(new ContextRegistrarBuildItem(new ContextRegistrar() {
            @Override
            public void register(RegistrationContext registrationContext) {
                registrationContext.configure(CallScoped.class).normal().contextClass(CallScopeContext.class) // it needs to be of type InjectableContext...
                        .done();
            }
        }, CallScoped.class));
    }
}
There is one slight difference to a standard CDI context. As you see, the context-class is registered during build-time by just giving the type. With CDI and a CDI extension, you would provide an instance to CDI. This way, you can create and share a single reference to your context with the CDI implementation and the application-side. I.e. for our CallScoped, the CallScopeContext offers an API to the application to start a scope on the current thread via enter and exit methods (see here).
Currently, this is a limitation of Quarkus as there is no possibility to share a single instance or access the runtime instance. But because state is usually stored in statics or thread-local, there is no problem in having actually two instances of the context-class; one used by Quarkus internally, one by the application-side. But support for this is already under consideration.
You can find the full code example here. It’s on a branch of my quarkus-sandbox repo which is a good starting point if you want to experiment with Quarkus + Quarkus Extensions (using Gradle).
jitpack.io for Gradle Plugins
29 June 2020
I extensively use the gradle-eclipse-compiler-plugin. This is a Gradle plugin that allows me to use the Eclipse JDT compiler for my Gradle builds instead of standard javac of my installed JDK.
Why is this useful? Because when I deploy e.g. a WAR file built with Gradle to an app-server and want to do remote-debugging and also hot-swap code in the debug session from my IDE, it is better to use the same compiler for both IDE and Gradle.
Otherwise this causes problems where constructs like lambda expression are compiled differently and the debug-session will not be able to swap the code; e.g. saying that methods where added or removed.
But this post is not about the usefulness of the plugin itself, but rather that it stopped working for me with Gradle 6 and I quickly wanted a fix that I can also distribute to other people. Obviously, I filed an issue and made a pull-request; but until the pull-request is merged how provide the fix to others? Meet jitpack.io which provides a maven repository for all of Github. You can request artifacts from this repository and what it will do is check out the code from GitHub and build it on the fly. You can use the version to reference specific branches or commits.
So, to use my fix/PR, I had to add the following to my Gradle project:
buildscript {
    repositories {
            maven { url 'https://jitpack.io' }
    }
    dependencies {
        classpath group: 'com.github.38leinaD', name: 'gradle-eclipse-compiler-plugin', version: 'fix~unrecognized-option-SNAPSHOT'
    }
}

apply plugin: 'de.set.ecj'
Async Profiler for Java
02 May 2020
Async-profiler is a low overhead sampling profiler for Java that produces nice flamegraphs to quickly see where CPU-cycles are eaten (event=cpu). It’s nice that it also shows where cycles are eaten in native code and is not biased twoards your application byte-code.
It also allows to analyze heap allocations (event=alloc).

You can either attach it to an already running Java application or use an agent to to attach it on startup.
Attach via agent on startup
java -agentpath:/home/daniel/tools/async-profiler-1.7-linux-x64/build/libasyncProfiler.so=start,event=cpu,file=/tmp/profile-cpu.svg,interval=1000000,framebuf=2000000,simple -jar target/myapp.jar
Attach to already running process
profiler.sh -e cpu -f /tmp/profile-cpu.svg -i 1000000 -b 2000000 -s <process-id>
Quarkus - Building Native Images on Windows
26 April 2020
I have been having trouble in the past to build native images for Quarkus applications under Windows due to a chain of issues.
With Quarkus 1.3.2.Final, I can finally confirm that I am sucessfully able to build. See below for the steps and exact environment used.
Steps
As I don’t have a Windows system, I downloaded the VirtualBox image of Windows 10 from Microsoft.
Within the VM, I installed GraalVM 2.0.0 for Java 11. See here for the latest releases.
I extracted GraalVM and from within the bin folder I ran gu install native-image to install the native-image tool.
I also set up PATH, GRAALVM_HOME and JAVA_HOME to point to the GraalVM folder. Well, PATH obviously to the bin folder.
Now, I installed Visual Studio 2019 as it is required for the native compilation. (the description on the GraalVM page is only very high-level)
Just because it is easier to describe and provide commands, I first installed Chocolatey which is a package manager for Windows.
After this, you should be able to install Visual Studio from your Powershell (as Admin) like this:
choco install visualstudio2019-workload-vctoolsAfter this, you should find this file on your filesystem:
C:\Program Files (x86)\Microsoft Visual Studio\2019\BuildTools\VC\Auxiliary\Build\vcvars64.batFinally, run your native-image build from a Command-prompt. Note that you have to call the vcvars64.bat to have the proper build environment:
call "C:\Program Files (x86)\Microsoft Visual Studio\2019\BuildTools\VC\Auxiliary\Build\vcvars64.bat"
mvnw package -Pnative -DskipTests
Quarkus - Testing against the latest code on master
13 April 2020
Quarkus is changing quickly. If you don’t want to wait for the next release or just need to test a fix quickly, there are two options to test against the latest code on master.
Build locally
First option is to build Quarkus on your local system.
git clone https://github.com/quarkusio/quarkus.git
cd quarkus
./mvnw clean install -Dquickly
Now, reference the version 999-SNAPSHOT in your gradle.properties:
quarkusPluginVersion=999-SNAPSHOT
quarkusPlatformArtifactId=quarkus-bom
quarkusPlatformVersion=999-SNAPSHOT
quarkusPlatformGroupId=io.quarkus
This works because you should have this in your build.gradle:
repositories {
    mavenLocal() // First look into local Maven repository under ~/.m2/repository
    mavenCentral()
}
Latest CI snapshots
Building Quarkus locally take a few minutes depending on your machine. Alternative is to use the latest snapshot that is published after each commit to master.
For this, you have to change your build.gradle to look into the snapshot repository:
repositories {
    mavenLocal()
    maven {
       url "https://oss.sonatype.org/content/repositories/snapshots"
    }
    mavenCentral()
}
You will have to do essentially the same in your settings.gradle because the repository for the Gradle plugin is resolved from here:
pluginManagement {
    repositories {
        mavenLocal()
        // Added the snapshots repo here!
        maven {
            url "https://oss.sonatype.org/content/repositories/snapshots"
        }
        mavenCentral()
        gradlePluginPortal()
    }
    plugins {
      id 'io.quarkus' version "${quarkusPluginVersion}"
    }
}
Obviously, you will also have to make the change to your gradle.properties like above.
Gradle by default caches snaptshots for 24 hours. If you want to force Gradle to pull the latest snapshot, you can run the build like this:
./gradlew build --refresh-dependencies
Debugging Quarkus tests (from Gradle-based build)
11 April 2020
If you dive deeper into Quarkus and develop more serious applications it shows that Gradle is only the second consideration after Maven. But it is unfair to make that argument because Quarkus also states that the Gradle-integrations is only in Preview. Anyway, I sometimes struggle to find the correct configurations that work for Gradle.
One useful config to know is: How to enable remote-debugging for your @QuarkusTest and step through the test?
It seems, the Quarkus Gradle plugin collects jvmArgs from any existing Test task. That’s why you can enable the debugger like this:
test {
    jvmArgs '-agentlib:jdwp=transport=dt_socket,server=y,suspend=y,address=5005'
}
Quarkus - Understanding GraalVM native-image & Reflection on the example of XML-parsing
10 April 2020
A long time ago I wrote a post on how to build a native-image with GraalVM. Lately, I have been doing the same in the context of Quarkus. In this post I want describe what I have learned about native-image and reflection in the context of Quarkus; but not necessarily limited to Quarkus.
It started with me wanting to build a native application for a simple Quarkus application that uses a JDK API for XML processing. I.e. it uses code like this:
private boolean isValidXmlFile(Path p) {
    try {
        if (p == null) return false;
        if (!p.toFile().exists()) return false;

        SAXParserFactory factory = SAXParserFactory.newInstance();
        factory.setValidating(false);
        factory.setNamespaceAware(true);

        SAXParser parser = factory.newSAXParser();

        XMLReader reader = parser.getXMLReader();
        reader.parse(new InputSource(new FileInputStream(p.toFile())));

        return true;
    }
    catch (SAXParseException spe) {
        return false;
    }
    catch (Exception e) {
        logger.error(String.format("Error while determining if file (%s) is a valid XML-file.",  p.getFileName().toString()), e);
        return false;
    }
}
I tried to build a native image by executing ./gradlew nativeImage and got this error when runing the native application.
Exception in thread "main" javax.xml.parsers.FactoryConfigurationError: Provider com.sun.org.apache.xerces.internal.jaxp.SAXParserFactoryImpl not found
    at javax.xml.parsers.FactoryFinder.newInstance(FactoryFinder.java:194)
    at javax.xml.parsers.FactoryFinder.newInstance(FactoryFinder.java:147)
    at javax.xml.parsers.FactoryFinder.find(FactoryFinder.java:271)
    at javax.xml.parsers.SAXParserFactory.newInstance(SAXParserFactory.java:147)
    at de.dplatz.bpmndiff.entity.Diff.isValidXmlFile(Diff.java:122)
    at de.dplatz.bpmndiff.entity.Diff.determineIfSupported(Diff.java:113)
    at de.dplatz.bpmndiff.entity.Diff.ofPaths(Diff.java:95)
    at de.dplatz.bpmndiff.entity.Diff.ofPaths(Diff.java:73)
    at de.dplatz.bpmndiff.control.Differ.diff(Differ.java:39)
    at de.dplatz.bpmndiff.boundary.DiffResource.diff(DiffResource.java:31)
    at de.dplatz.bpmndiff.boundary.DiffResource_ClientProxy.diff(DiffResource_ClientProxy.zig:51)
    at de.dplatz.bpmndiff.UICommand.call(UICommand.java:65)
    at de.dplatz.bpmndiff.UICommand.call(UICommand.java:27)
    at picocli.CommandLine.executeUserObject(CommandLine.java:1783)
    at picocli.CommandLine.access$900(CommandLine.java:145)
    at picocli.CommandLine$RunLast.executeUserObjectOfLastSubcommandWithSameParent(CommandLine.java:2150)
    at picocli.CommandLine$RunLast.handle(CommandLine.java:2144)
    at picocli.CommandLine$RunLast.handle(CommandLine.java:2108)
    at picocli.CommandLine$AbstractParseResultHandler.execute(CommandLine.java:1975)
    at picocli.CommandLine.execute(CommandLine.java:1904)
    at de.dplatz.bpmndiff.UICommand.run(UICommand.java:55)
    at de.dplatz.bpmndiff.UICommand_ClientProxy.run(UICommand_ClientProxy.zig:72)
    at io.quarkus.runtime.ApplicationLifecycleManager.run(ApplicationLifecycleManager.java:111)
    at io.quarkus.runtime.Quarkus.run(Quarkus.java:61)
    at io.quarkus.runtime.Quarkus.run(Quarkus.java:38)
    at io.quarkus.runner.GeneratedMain.main(GeneratedMain.zig:30)
Caused by: java.lang.ClassNotFoundException: com.sun.org.apache.xerces.internal.jaxp.SAXParserFactoryImpl
    at com.oracle.svm.core.hub.ClassForNameSupport.forName(ClassForNameSupport.java:60)
    at java.lang.Class.forName(DynamicHub.java:1197)
    at javax.xml.parsers.FactoryFinder.getProviderClass(FactoryFinder.java:119)
    at javax.xml.parsers.FactoryFinder.newInstance(FactoryFinder.java:183)
    ... 25 more
If you have read my previous post, you already know that a JSON-file needs to be provided to native-image so reflection can be used on these classes during runtime of the native application.
Based on the error, I was able to construct a file reflect-config.json with this content:
[
  {
    "name": "com.sun.org.apache.xerces.internal.jaxp.SAXParserFactoryImpl",
    "methods": [
      {
        "name": "<init>",
        "parameterTypes": []
      }
    ]
  }
]
Where does this file have to be placed so native-image picks it up? For Quarkus, there are three options:
-
Place in
src/main/resourcesand reference via application.properties (see QUARKUS - TIPS FOR WRITING NATIVE APPLICATIONS) -
Place in
src/main/resourcesand reference via build.gradle (see QUARKUS - TIPS FOR WRITING NATIVE APPLICATIONS) -
Place in
src/main/resources/META-INF/native-imageand no further configuration is needed. It will be picked up automatically by convention.
For some reason, this third and simplest solution is not mentioned in the Quarkus guide; but maybe this is a new feature in GraalVM.
Resource Bundles
After having done this, I build the native image again and ran my application. When it tried to parse a non-XML-file I was getting this new error:
java.util.MissingResourceException: Could not load any resource bundle by com.sun.org.apache.xerces.internal.impl.msg.XMLMessages
    at jdk.xml.internal.SecuritySupport.lambda$getResourceBundle$5(SecuritySupport.java:274)
    at java.security.AccessController.doPrivileged(AccessController.java:81)
    at jdk.xml.internal.SecuritySupport.getResourceBundle(SecuritySupport.java:267)
    at com.sun.org.apache.xerces.internal.impl.msg.XMLMessageFormatter.formatMessage(XMLMessageFormatter.java:74)
    at com.sun.org.apache.xerces.internal.impl.XMLErrorReporter.reportError(XMLErrorReporter.java:357)
    at com.sun.org.apache.xerces.internal.impl.XMLErrorReporter.reportError(XMLErrorReporter.java:327)
    at com.sun.org.apache.xerces.internal.impl.XMLScanner.reportFatalError(XMLScanner.java:1471)
    at com.sun.org.apache.xerces.internal.impl.XMLDocumentScannerImpl$PrologDriver.next(XMLDocumentScannerImpl.java:1013)
    at com.sun.org.apache.xerces.internal.impl.XMLDocumentScannerImpl.next(XMLDocumentScannerImpl.java:605)
    at com.sun.org.apache.xerces.internal.impl.XMLNSDocumentScannerImpl.next(XMLNSDocumentScannerImpl.java:112)
    at com.sun.org.apache.xerces.internal.impl.XMLDocumentFragmentScannerImpl.scanDocument(XMLDocumentFragmentScannerImpl.java:534)
    at com.sun.org.apache.xerces.internal.parsers.XML11Configuration.parse(XML11Configuration.java:888)
    at com.sun.org.apache.xerces.internal.parsers.XML11Configuration.parse(XML11Configuration.java:824)
    at com.sun.org.apache.xerces.internal.parsers.XMLParser.parse(XMLParser.java:141)
    at com.sun.org.apache.xerces.internal.parsers.AbstractSAXParser.parse(AbstractSAXParser.java:1216)
    at com.sun.org.apache.xerces.internal.jaxp.SAXParserImpl$JAXPSAXParser.parse(SAXParserImpl.java:635)
    at de.dplatz.bpmndiff.entity.Diff.isValidXmlFile(Diff.java:129)
    at de.dplatz.bpmndiff.entity.Diff.determineIfSupported(Diff.java:113)
    at de.dplatz.bpmndiff.entity.Diff.ofPaths(Diff.java:95)
    at de.dplatz.bpmndiff.entity.Diff.ofPaths(Diff.java:73)
    at de.dplatz.bpmndiff.control.Differ.diff(Differ.java:39)
    at de.dplatz.bpmndiff.boundary.DiffResource.diff(DiffResource.java:31)
    at de.dplatz.bpmndiff.boundary.DiffResource_ClientProxy.diff(DiffResource_ClientProxy.zig:51)
    at de.dplatz.bpmndiff.UICommand.call(UICommand.java:65)
    at de.dplatz.bpmndiff.UICommand.call(UICommand.java:27)
    at picocli.CommandLine.executeUserObject(CommandLine.java:1783)
    at picocli.CommandLine.access$900(CommandLine.java:145)
    at picocli.CommandLine$RunLast.executeUserObjectOfLastSubcommandWithSameParent(CommandLine.java:2150)
    at picocli.CommandLine$RunLast.handle(CommandLine.java:2144)
    at picocli.CommandLine$RunLast.handle(CommandLine.java:2108)
    at picocli.CommandLine$AbstractParseResultHandler.execute(CommandLine.java:1975)
    at picocli.CommandLine.execute(CommandLine.java:1904)
    at de.dplatz.bpmndiff.UICommand.run(UICommand.java:55)
    at de.dplatz.bpmndiff.UICommand_ClientProxy.run(UICommand_ClientProxy.zig:72)
    at io.quarkus.runtime.ApplicationLifecycleManager.run(ApplicationLifecycleManager.java:111)
    at io.quarkus.runtime.Quarkus.run(Quarkus.java:61)
    at io.quarkus.runtime.Quarkus.run(Quarkus.java:38)
    at io.quarkus.runner.GeneratedMain.main(GeneratedMain.zig:30)
So, it seems not only reflection needs to be configured for native-image builds, but also resources and resource-bundles (e.g. localized error message). I solved this by placing a resource-config.json in the same folder:
{
    "resources": [],
    "bundles": [
        {"name":"com.sun.org.apache.xerces.internal.impl.msg.XMLMessages"}
    ]
}
After this, my native application was working succesfully.
There are two things to note here:
-
Normally, this kind of configuration should not be needed for JDK-internal classes and APIs like the SAXParser. Unfortunately, there is a pending issue about the
java.xmlmodule: https://github.com/oracle/graal/issues/1387. -
Adding the
com.sun.org.apache.xerces.internal.impl.msg.XMLMessagesresource-bundle should also not be necessary. But even if it would be working, there is still an issue that only the default locale is added to the native application; other locales would need to be added via the mechansim I have described (e.g.com.sun.org.apache.xerces.internal.impl.msg.XMLMessages_defor german messages). See the issue for details: https://github.com/oracle/graal/issues/911.
Automatically generating config files.
What I have done up to now is write the files manually. Is there a simpler way? Well, I don’t really have much experience yet with generating these files but it can be done:
GraalVM comes with an agent that can be used to trace all the reflective access when running your application in normal JVM-mode.
java -agentlib:native-image-agent=trace-output=/home/daniel/junk/trace.json -jar my-app.jar
This will generate a trace of all reflective access and you can use it as help to generate your configuration manually.
Even simpler, the agent can be used to create the files that you can place under src/main/resources/META-INF/native-image:
java -agentlib:native-image-agent=experimental-class-loader-support,config-output-dir=../src/main/resources/META-INF/native-image/ -jar my-app.jar
Would this have helped us with the SAXParser problem from above? Unfortunately not. At least not currently, because the agent specifically will not generate configuration for relective access of JDK-internal classes; it is only meant for libraries external to the JDK. Why? Because normally, it is assumed that all JDK internals are handled without any configuration needed. Unfortnunately, we have seen that this is currently not the case for the jaxa.xml module.
Using JDK Preview Features from a Gradle-based Eclipse-project
01 March 2020
This post is about working with preview features of Java (e.g. JDK 13’s switch expressions preview) from your Gradle project within Eclipse IDE with zero manual configuration. On top of that, my project uses Quarkus which only makes a minimal difference as we have to consider the dev-mode as well.
If you are working with javac and java on the command-line only, it is very simple in general: You have to pass --enable-preview as an argument to javac and java.
In your build.gradle file you can do it like this:
// Enable for Java Compiler on src/main/java
compileJava {
    options.compilerArgs += ["--enable-preview"]
}

// Enable for Java Compiler on src/test/java
compileTestJava {
    options.compilerArgs += ["--enable-preview"]
}

// Enable for running tests
test {
    jvmArgs '--enable-preview'
}

// Enable for Quarkus DevMode runner which was my main use-case
quarkusDev {
    jvmArgs '--enable-preview'
}
If you use preview features in your source-code, running a gradlew build on the commandline should now compile your code.
You can run the built JAR with java --enable-preview -jar app.jar.
In case you want to run your application from Gradle, you will have to configure the JVM args for this as well in your build.gradle; See the JavaExec task.
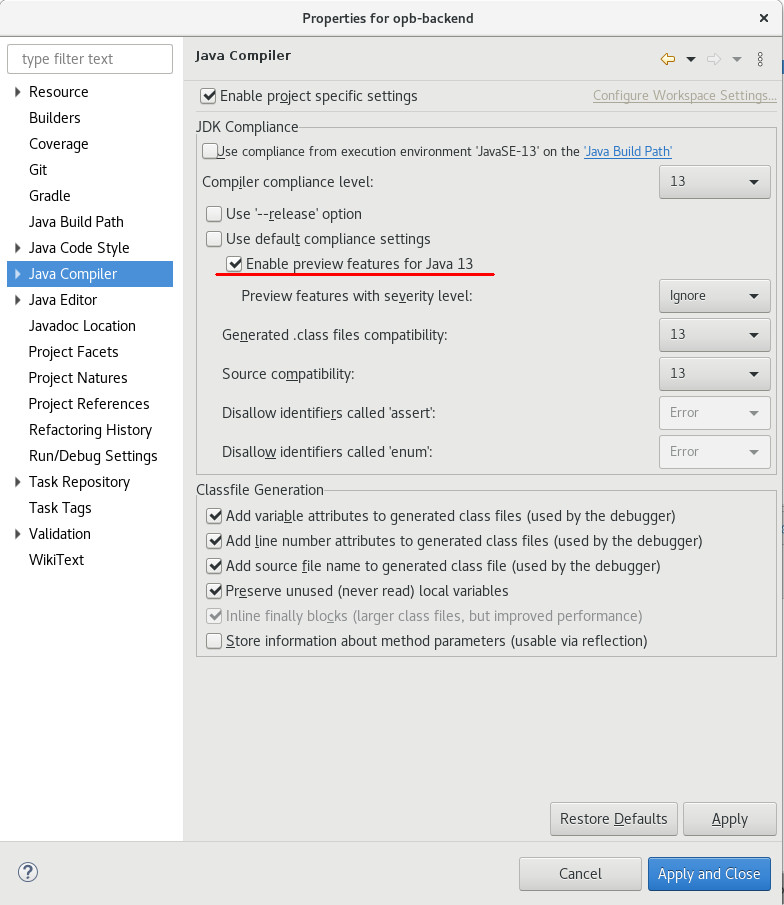
Unfortunately, Eclipse will not automatically infer the right settings for the Eclipse compiler and will show compile errors in your IDE. The quick fix is to manually enable the preview feature in the Java Compiler project-settings (right-click on the project; Properties > Java Compiler; check 'Enable preview features for Java 13'), but I would prefer that there are no manual steps needed. I.e. a team member should be able to clone a Git repo, import it into Eclipse and all should be set up automatically.
On our way of achieving this, you first have to add this to our build.gradle:
// Add plugin at top of your build.gradle
apply plugin: 'eclipse'

// ...

//Buildship doesn't use that hooks (https://discuss.gradle.org/t/when-does-buildship-eclipse-customization-run/20781/2)
//you need to run `gradle eclipseJdt` separately
eclipse.jdt.file.withProperties { props ->
    props['org.eclipse.jdt.core.compiler.problem.enablePreviewFeatures']= 'enabled'
    props['org.eclipse.jdt.core.compiler.problem.reportPreviewFeatures']= 'ignore'
}
It found it in this Eclipse JDT Github issue.
When you now run the Gradle-task eclipseJdt you can do a Refresh of your Gradle project in Eclipse afterwards and you should see that the Java Compiler settings in Eclipse also have been properly set.
The ultimate goal is that we don’t have to run this gradle-task manually. To achieve this, we can leverage another quiet new Buildship feature that triggers a gradle task whenever a project is imported into Eclipse or the project is refreshed. You can read about it here.
eclipse {
    synchronizationTasks eclipseJdt
}
This is the last missing piece. Once you import the project into Eclipse, this task will automatically trigger and configure the Eclipse compiler. No manual steps or instructions you have to give to your team mates how to get the project imported properly.
I was expecting this task to also be triggered when you run "Refresh Gradle Project" for an already imported project, but this did not work for me yet. Instead, I had to delete the project from Eclipse and import it again. I still have to find out why.
Improving on Integration-Testing (with Arquillian)
04 September 2019
Introduction
Arquillian is a testing-framework for Jakarta EE applications (formerly Java EE).
System-tests are run as a remote-client invoking a boundary-component of the tested application; e.g. an exposed JAX-RS/REST-endpoint.
Integration-tests are run within the container; allowing to test internal components of the application; e.g. you can inject an EJB or CDI-bean into your test and invoke a method.
Both types of tests have advantages and disadvantages where I find that the disadvantages of Integration-tests often outweight the benefits (in my projects).
|
Note
|
You can find a good introduction on different testing-techniques and their advantages/disadvantages in this article series by Sebastian Daschner. |
Let me explain: The Jakarta EE applications that I am involved with are usually large, business-focused applications. This means, that I am rarely interested in testing the framework or the container. I am interested in testing how the application behaves in the correct way from a business-perspective. This can often be done quiet nice by calling external REST endpoints. My development-cycle involves a deployed/running application that allows me to hot-swap small code-changes (e.g. via Java’s remote-debugging API) and then invoke the system-test again to see if I get the expected result. Rinse and repeat.
Integration-tests on the other-hand don’t allow me the quick feedback cycle I get from system-tests. As the tests themselfs run in the server/application (and thus are deployed as part of the main WAR/EAR), I have to deploy a whole WAR/EAR to the app-server, run the tests and shut down the container again. If i make a change to the application-code or test, I have to repeat this rather long cycle where I do a full deployment.
The cycle is especially long when the application is not very modular/loosely coupled. Arquillian theoretically allwows me to build small test-deployments with Shrinkwrap but depending on the application the test-archive often has same magnitude as the whole application. So, deployment and thus testing is slow.
What I somtimes would like to have is the quick feedback-loop I get with system-tests but beeing able to test internals of the application that are not exposed via a Rest-endpoint.
How can we get integration-tests that behave more like system-tests? How can we get system-tests that allow us to call internal components of the application?
WarpUnit
Meet WarpUnit. I have been reading about it some time ago and found the idea quiet nice. It is a small testing-solution which allows you to run a system-test but be able to have snippets of code (lambda expressions) that are invoked within the container on server-side. Actually, the approach even allows injection of server-components similar to Arquillian’s integration-tests. Have a look at this very neat concept.
public class GreeterGrayBoxTest {

    @Inject
    Greeter greeter;

    @Test
    public void testGreeter() {

        System.out.println("This is printed in the JUnit test output");

        WarpGate gate = WarpUnit.builder()
                .primaryClass(GreeterGrayBoxTest.class)
                .createGate();

        String greetingForBob = gate.warp(() -> {
            System.out.println("This is printed in the server log");
            return greeter.greet("Bob");
        });

        Assert.assertEquals("Greetings, Bob !",greetingForBob);
    }
}
What happens here is that the gate.warp()-call will take the bytecode of our GreeterGrayBoxTest class, upload it to the server, load it via a custom class-loader and invoke the lambda within the server.
Even though the repo did not see a commit for a long time, the solution works when you use it with a recent Wildfly or Liberty. (Actually, the maintainers invited me to contribute and I made a small pull-request to fix the build; a jboss/redhat maven repo URL had changed.)
|
Note
|
Just found out about Arquillian Warp which seems to follow a similar approach. |
Taking it to the next Level
What I would like to have as a final solution is something that can transparently run as an Arquillian integration-test but can also be invoked like a WarpUnit-style test from outside the application-server.
You can find my proof-of-concept solution on GitHub.
@RunWith(Warp.class)
public class ArquillianStyleIntegrationTest {

    @Inject
    Greeter greeter;

    @Test
    public void testGreeter() {
        System.out.println("This is printed in the server log");

        String result =  greeter.greet("Bob");

        assertThat(result, is("Greetings, Bob !"));
    }
}
Here, the whole testGreeter method is run within the application-server instead of just running some code-snippets in the server. This is a great approach while doing development because I can make quick-changes in my test-code and rerun the test. When I am done, the approach allows me to just swtich the annotation from @RunWith(Warp.class) to @RunWith(Arquillian.class) and I am able to run it as a regular arquillian integration-tests.
Obviously, it would be nice to have a deeper arquillian integration that does not require me to change the annotation for this. Instead, it should be transparently handled by an arquillian extension. But this is for the future; after seeing if this approach works in real-world projects.
Javascript Router-friendly packaging as WAR-archive
26 August 2019
Routers in modern Javascript framworks usually support path’s similar to a Restful API. I.e. when the main page is localhost:8080 and shows the landing page; then localhost:8080/products/1 might show the page with the details for Product #1.
For a single-page application an in-app link to localhost:8080/products/1 should not trigger a reload of the whole application but should be handled within the app. This is the main job of the router.
A lot of Javascript frameworks support this routing based on the browser’s history API. Vaadin Router is just one example. Similar routers exist in Angular and friends.
For this to work, the web-server needs to serve the localhost:8080/index.html for any of these sub-resources/pages. This is because the Router in the Javascript code will deconstruct the URL and show the right page-fragments.
How can this be achived in a JavaEE environment where your front-end Javascript application is packaged inside a WAR-file?
Simple. Just use this web.xml:
<web-app xmlns="http://xmlns.jcp.org/xml/ns/javaee"
    xmlns:xsi="http://www.w3.org/2001/XMLSchema-instance"
    xsi:schemaLocation="http://xmlns.jcp.org/xml/ns/javaee
    http://xmlns.jcp.org/xml/ns/javaee/web-app_3_1.xsd"
    version="3.1">
    <welcome-file-list>
        <welcome-file>index.html</welcome-file>
    </welcome-file-list>
    <error-page>
        <error-code>404</error-code>
    <location>/index.html</location>
    </error-page>
</web-app>
A programatic solution is to use a servlet-filter that always routes to the index.html. Here is from the post on Quarkus and Web UI Development.
JavaEE App Deployment on Openshift/Minishift
23 June 2019
I have been watching this free course by RedHat to get started on OpenShift. This post contains my personal notes on the most important commands and concepts for later reference.
Getting started with MiniShift
I already wanted to do the course a few month back on my laptop running CentOS linux; but for some reason I ran into problems installing MiniShift. After reinstalling my laptop with Debian, I gave it another go. There have been a few small problems that cost me some time along the way and I will describe them as well
After installing Minishift (which is a local OpenShift cluster running in a VM), the intial steps are simple:
minishift start // starts the cluster
eval $(minishift oc-env) // to connect the oc commandline-tool from OpenShift to the local cluster
oc login -u developer // log into the OpenShift cluster via the oc commandline-tool; password can be anything non-empty
Essentially OpenShift runs your applications in Kubernetes (MiniShift uses minikube) and Docker; so this is what minishift start will boot up in a VM. Read more about it here.
You can open the OpenShift web-console with minishift console and log in with user developer and any non-empty password. We can use it later to inspect the deployed applications and see the logs of the running containers; even connecting to a shell within the container can be done via the web console.
This is also a good place to introduce the concept of projects in OpenShift. Actually, there is also the concept of projects in Minishift, but with minishift start a default project named minishift is created and I usually get along with this single project quiet good.
For the OpenShift project this is different. You should use a single project for deploying all your modules/microservices that make up your application. So, if you are working on different customer-projects, it would be natural to also define different projects in OpenShift for it.
Here, I will be working with a project named junk. It is created and activated via
oc new-project junk
This is important later on, because Docker images we build need to be tagged with the project-name for OpenShift beeing able to use them.
Also, note that once you stop and start MiniShift, the default OpenShift project might be active (check with oc projects) and you will have to run oc project junk to activate junk; otherwise it might happen that oc commands interacte with the wrong project.
Building and deploy from source via S2I and templates
The most prominent approach for deploying your application on OpenShift is via Source-2-Image. What this means is that effectively your application is built from sources (Maven, Gradle, …) within a Docker container. The resulting artifact (e.g. WAR-file) is then put in another Docker container (e.g. Wildfly) to start the application.
Additionally, there is the concept of templates. These templates and their parameters are documented in a good way so that you basically only have the point the template to a Git Repo URL containing a Maven build. The template will do the job of building and deploying the artifact.
Minishift does not come with templates for JBoss/Wildfly preinstalled. But you can easily add a JBoss EAP 7 template by running
oc replace --force -f https://raw.githubusercontent.com/jboss-openshift/application-templates/master/eap/eap71-basic-s2i.json
You can inspect the template parameters with
oc describe template eap71-basic-s2i
Lets launch a simple Maven-based JavaEE project via the JBoss EAP 7 template:
oc new-app --template=eap71-basic-s2i -p SOURCE_REPOSITORY_URL=https://github.com/AdamBien/microservices-on-openshift.git -p CONTEXT_DIR=micro -p SOURCE_REPOSITORY_REF=master --name=micro
This approach works quiet nicely, but as you would normally build your application on a Jenkins or similar build-server, the approach seems not so useful for serious projects.
Deploy via Image Streams
From now on we assume the JavaEE WAR/EAR was built via Gradle/Maven on Jenkins and we only want to use OpenShift to deploy it.
For this we can use the concept of Image Streams. Essentially, it is just another abstraction on top of Docker.
As tags like latest (or even specific versions) can be overwritten in a Docker registry, Image Streams give Docker images a handle that can be used today or tomorrow even when the version was overwritten.
To be concrete: You deploy your application on a docker image appserver:latest, the Image Stream in OpenShift will make sure to always take the same Docker image for deployment even when containers are built after latest already points to a new image. The handle will only be updated when you proactively decide so. This allows reproduceable build/deployments and removes the level of suprise when a new deployment is pushed to production on a Friday afternoon.
To demonstrate the steps, I will be using the demo repo from the course but please note that it could be any other Maven/Gradle-based project that produces a JavaEE WAR/EAR-file.
git clone https://github.com/AdamBien/microservices-on-openshift.git
cd microservices-on-openshift/micro
mvn package
This should have produced a micro.war under the microservices-on-openshift/micro/target folder.
Lets first check what Image Streams OpenShift knows about (you can also reference images from DockerHub or your local docker registry but more on that later):
oc get is -n openshift
Let’s define an application using the wildfly image-stream.
oc new-app wildfly:latest~/tmp --name=micro
The trick used by Adam here is to give /tmp or some other empty folder to the command because we don’t want OpenShift to build our application. Normally, you would give the path to a Git Repo or a folder containing a pom.xml. In this case, OpenShift would do the build from source again.
Instead, we use the oc start-build command and give the already built artifact:
oc start-build micro --from-file=target/micro.war
To expose the application to the outside world via a load-balancer, run
oc expose svc micro
In the web-console you should be able to go to your project and under it to Applications/Routes. Here you will find a link to access you applications HTTP port.
The URL to access the Rest endpoint should look similar to this: http://micro-junk.192.168.42.3.nip.io/micro/resources/ping.
DNS issues
A problem that bugged me for some time was the concept of the nip.io domain and that DNS servers should resolve it to the IP given as subdomain.
It would not have been a problem if my system was set up to use e.g. the Google DNS servers. Instead, on my Debian/local network, there is some local DNS server and it was not able to resolve the nip.io domain.
To make it work, I had to set up the Google DNS servers on my system. Namely, 8.8.8.8 and 8.8.4.4. After this, I was able to call the Rest endpoint.
Local DNS
For some time I also played around with a local DNS server coming as an experimental feature, but I moved away from it again because it was not really necessary. Anyway, below are the steps if you want to try it:
export MINISHIFT_ENABLE_EXPERIMENTAL=y
minishift start
minishift dns start
patch /etc/resolv.conf
Deleting resources
As you are playing around in OpenShift, it is often useful to start from scratch again. Actually, we should do it to demonstrate a different approach to deploy our application.
All resources in OpenShift are labeled with the application-name (oc get all -l app=micro). So, in our case, we can delete our application and all its resources by running
oc delete all -l app=micro
Image Stream from own Docker image
I assume you have run the oc delete command because we now want to deploy our micro application again, but in a different way: deployed in a Docker container that we have built ourselfs.
I.e. we want to use our own Docker images within OpenShift’s concept of Image Streams.
First, we need to connect our Docker client to the Docker runtime in MiniShift:
eval $(minishift docker-env)
Try docker ps now and you should see all the Docker containers running in your OpenShift environment.
We can now do a docker build as usual; we just have to make sure to tag it correctly.
As OpenShift exposes a Docker registry, we need to tag the image for this registry (we can get it from minishift openshift registry); and additionally, there is the convention that the image-name need to include the name of the OpenShift project and the application-name. So, the full build-command looks liḱe this:
docker build -t $(minishift openshift registry)/junk/micro .
docker login -u developer -p $(oc whoami -t) $(minishift openshift registry)
docker push $(minishift openshift registry)/junk/micro
oc new-app --image-stream=micro
oc expose svc micro
oc status
Important concepts
Below are some more important concepts for deploying applications to the cloud and the respective commands.
Scale
You can scale the number of replicas/containers with below command:
oc scale --replicas=2 dc ping
oc get all
As OpenShift exposes your service via a load-balancer, this is completely transparent and you might be routed to any of the started containers.
Configuration
In Java you can access environment variables via System.getenv.
This is a standard mechanism to configure you application in cloud-native applications.
Below is the command to set such an environment variable for your service.
oc set env dc/ping --list
oc set env dc/ping message='Hello World'
What will happen, is that OpenShift restarts all containers and places the new config in the environment.
You application will now get Hello World when invoking System.getenv("message").
Health check
Every application should define some external health-check endpoint. This allows external tools or e.g. OpenShift to monitor the state of the application. For this, Kubernetes defines two different health-checks. Readyness probes to test if the application is ready/started; and liveness probes to test if the application is still alive and responding. Below are the commands to set each. You Rest-service simply needs to respond with HTTP responce-code 200 is everything is fine; 500 in case to indicate the opposite.
oc set probe dc/ping --liveness --get-url=http://:8080/ping/resources/health
oc set probe dc/ping --readiness --get-url=http://:8080/ping/resources/health
Useful Wildfly Undertow Config
21 May 2019
Below you find two useful Wildfly configurations.
Configure server-side SSL
Copy your Java Keystore to $JBOSS_HOME/standalone/configuration/server.jks and modify your standalone-full.xml:
<tls>
    <key-stores>
        <key-store name="LocalhostKeyStore">
            <credential-reference clear-text="secret"/>
            <implementation type="JKS"/>
            <file path="server.jks" relative-to="jboss.server.config.dir"/>
        </key-store>
    </key-stores>
    <key-managers>
        <key-manager name="LocalhostKeyManager" key-store="LocalhostKeyStore" alias-filter="servercert">
            <credential-reference clear-text="secret"/>
        </key-manager>
    </key-managers>
    <server-ssl-contexts>
        <server-ssl-context name="LocalhostSslContext" key-manager="LocalhostKeyManager"/>
    </server-ssl-contexts>
</tls>
<subsystem xmlns="urn:jboss:domain:undertow:4.0">
<buffer-cache name="default"/>
<server name="default-server">
<.../>
<https-listener name="https" socket-binding="https" ssl-context="LocalhostSslContext" enable-http2="true"/>
<.../>
</server>Use undertow as a reverse proxy
When accessing the Wildfly on http://localhost:8080/my-app, forward to 192.168.1.2 at port 8888.
<subsystem xmlns="urn:jboss:domain:undertow:4.0">
    <server name="default-server">
        <host name="default-host" alias="localhost">
             <.../>
            <location name="/my-app" handler="my-app-proxy"/>
        </host>
    </server>
    <.../>
    <handlers>
        <.../>
        <reverse-proxy name="my-app-proxy">
            <host name="localhost" outbound-socket-binding="my-app-binding" scheme="http" path="/my-app" instance-id="my-app-route"/>
        </reverse-proxy>
    </handlers>
    <.../>
</subsystem>
<socket-binding-group name="standard-sockets" default-interface="public" port-offset="${jboss.socket.binding.port-offset:0}">
<.../>
<outbound-socket-binding name="my-app-binding">
<remote-destination host="192.168.1.2" port="8888" />
</outbound-socket-binding>
<.../>How to print Emoji characters in your Java command-line application
31 March 2019
In general, you only have colors and font-weight to work with when you are in a regular terminal application. Using emoji chracters allows to use different visual markers than what we are noramlly used to.
See below for how it works in Java:
-
Go to this index and find emoji to use. E.g. "Grinning Face" has UTF-16 code
U+1F600. -
Go to fileformat.info and query for
U+1F600. -
Click on the returned result and find the row "C/C++/Java source code"; which should show
"\uD83D\uDE00". -
Put
System.out.println("\uD83D\uDE00")into your Java application.
If you run this application in a terminal and the font supports it, you should see the grinning face 😀.
How to handle ES6 bare module imports for local Development
26 March 2019
|
Note
|
This post has been updated to also include Pika |
|
Note
|
Yet another interesting tool is jspm. Thanks to @hallettj for mentioning it to me. |
When prototyping a Javascript-based web-application, I prefer a lightweight approach in which I just have VSCode, the latest Chrome version and browser-sync. No transpiler, bundler, etc. The browser is refreshed each time I save a file and I get immediate feedback on any CSS, HTML or JavaScript changes I have made.
Unfortunately, just using browser-sync does not work as soon as you want to import ES6 modules from third-party. Like, for example, lit-element.
I will show in what cases ES6 imports are not working natively in the browser for external dependencies and show different mechanism to work around it for your development environment.
Problem
An ES6 import will cause problems as soon as you have bare imports. A bare import is one that you usually see when working with bundlers like Webpack: it is not a relative path to your node_modules but… bare.
import { html, LitElement } from 'lit-element/lit-element.js';And when bundling the application with e.g. Webpack, this would be working fine. But if directly run in the browser, you would see:

Uncaught TypeError: Failed to resolve module specifier "lit-element/lit-element.js". Relative references must start with either "/", "./", or "../".
NodeJS supports bare imports and its resolution but browsers do not support it as of now.
Now I can try to be smart and change it to a relative import
import { html, LitElement } from './lit-element/lit-element.js';and make browser-sync serve files from the node_modules directory as follows:
browser-sync src node_modules -f src --cors --no-notify
I will get a different but similar error.
Uncaught TypeError: Failed to resolve module specifier "lit-html". Relative references must start with either "/", "./", or "../".
Even though I was no able to import lit-element, it is now choking on lit-html which is a bare import in the lit-element sources itself.
So, it seems we are stuck as any external library that contains ES6 imports will fail if the imports are not first rewritten like Webpack will do.
Got here and search for "Bare" import specifiers aren’t currently supported.
Solutions
Here are the solutions I have found when my main requirement is to keep a good developer experience like I have with browser-sync alone (lean and simple).
Unpkg.com
Unpkg acts like a CDN and offers popular NPM packages via http. The nice thing is that bare imports are rewritten. So, changing the import to this will work fine:
import { html, LitElement } from 'https://unpkg.com/@polymer/lit-element@latest/lit-element.js?module';The ?module does the magic of rewriting bare imports.
I can now continue working with browser-sync like before:
browser-sync src -f src --cors --no-notify
The downside of this approach is that the application is not local/self-contained; I have to fetch something from the internet; which can be bad if your internet speed is slow. Actually, it will be cached; but it will hit the internet anyway for cache-validation. Also, this will not work if you are trying to work offline.
Webpack
As mentioned before, a bundler sloves the import problem for us by inlining or rewriting the imports. But I am no fan of this approach as this bundling step can slow down the turn-around time from saving the file to the browser actually reloading. Anyway, the steps are:
-
`npm install --save-dev webpack webpack-cli copy-webpack-plugin webpack-dev-server `
-
Create
webpack.config.js:const path = require('path'); const CopyPlugin = require('copy-webpack-plugin'); module.exports = { entry: './src/app.js', mode: 'development', output: { path: path.resolve(__dirname, 'dist'), filename: 'app.js' }, devServer: { contentBase: './dist' }, plugins: [ new CopyPlugin([ { from: 'src/index.html', to: './' }, { from: 'src/style.css', to: './' }, ]), ], }; -
Add a script to the
package.json:"dev": "webpack-dev-server --open" -
The import can now look like this:
import { html, LitElement } from 'lit-element/lit-element.js';
Run the dev-server with live-reload (similar to browser-sync) with npm run dev.
After trying it for a small application and really only doing the bare minimum with Webpack, I have to say it is a viable option.
But it requires to download some dependencies from NPM and create a webpack.config.js.
Open Web Components (OWC)
Open Web Components offer a simple dev-server that does nothing more than rewrite the bar module imports to relative imports.
npm install --save-dev owc-dev-server
After trying it out, I was disappointed to find that the dev-server does not offer live-reloading.
The best solution I found was to combine it with browser-sync.
Here are the scripts I added to my package.json
"dev": "owc-dev-server | npm run watch",
"watch": "browser-sync start -f src/ --proxy localhost:8080 --startPath src",
Note that watch is just a helper-script used by dev; so you have to use npm run dev.
Polymer-cli
The last tool I tried was Polymer-CLI.
In the end, the approach is a mix between the previous two. It requires an additional polymer.json config-file and it also does not function without browser-sync.
The steps are:
-
npm install --save-dev polymer-cli -
Create
polymer.json:{ "entrypoint": "src/index.html", "shell": "src/app.js", "npm": true } -
Set up scripts:
"watch": "browser-sync start -f src/ --proxy localhost:8000 --startPath src",
"dev": "polymer serve --open-path src/index.html | npm run watch"
See here for the issue to natively support live-reload.
Pika
One more nice tool was mentioned to me in the reactions to this post. So, I felt inclined to try it and after all also include it here.
What @pika/web does, is described nicely in this article. It actually is a great addition to my post because it adds to the same discussion that you should not be required to use bundlers just to get all the webcomponents / ES6 goodness working.
Pika moves the bundling step from where you have to run the bundler for your application, to just running a bundler/tool once for each installed dependency in your package.json.
I.e. what it does is take your dependencies from node_modules and repackages/bundles them under the folder web_modules. The repackaged dependency no longer contains bare imports and can easily be include. Just run
npm install && npx @pika/web
Now, you could import like below and continue using browser-sync.
import { html, LitElement } from './web_modules/lit-element.js';
Note that I don’t like having to put web_modules in the path. So what I ended up doing was importing like this
import { html, LitElement } from './lit-element.js';
and just let browser-sync serve from src and web_modules.
browser-sync src web_modules -f src --cors --no-notify
Summary
After trying out all these options, I have to say that non is as lightweight and simple as using plain browser-sync.
I can work with the Webpack and the OCW approaches. Webpack is a standard tool to learn anyway. And OCW has a lightweight dev-serverthat just rewrites the imports on the fly; no bundling step. But sadly, it does not come with live-reload out of the box and requries to combine it with browser-sync. Polymer-CLI is just to heavyweight for what I need from it (also requiring a config-file) and unpkg.com is no option as I want to be able to work offline.
Pika was only added after I intially wrote this post. But I will keep trying it in the next way. From the first impression, I have to say that I really like that I can just continue using plain browser-sync.
As the dependency on other libraries via ES6 imports will only get more important, I am eagerly awaiting a solution. Maybe import-maps will the way to go.
Debugging a JSF/MyFaces error on Websphere
11 March 2019
This is a summary of the steps necessary to debug one kind of nasty bug in JSF.
Today I was debugging a JSF issue on Websphere where the backing-bean was not called for an Ajax form submit. Actually, the command-button action was called but the model values for the form inputs where not set. On JBoss all was fine and also under Webphere there was no error written to any log or such. The partial response just returned the old model values.
A colleague recommended to play around with partial-state-saving and so I did. I first captured the viewId to only disable partial-state-saving for my page.
System.out.println("ViewID is " + FacesContext.getCurrentInstance().getViewRoot().getViewId());And set it like this in the web.xml:
<context-param>
    <param-name>javax.faces.FULL_STATE_SAVING_VIEW_IDS</param-name>
    <param-value>/myviewid.xhtml</param-value>
</context-param>
This setting at at least made a NPE appear in the partial-response. But without a full stacktrace.
<partial-response><error><error-name>java.lang.NullPointerException<error-name>...</error></partial-response><errorThe next step was to install OmniFaces' FullAjaxExceptionHandler.
web.xml
 <error-page>
    <error-code>500</error-code>
    <location>/WEB-INF/errorpages/500.xhtml</location>
 </error-page>
faces-config.xml
<factory>
    <exception-handler-factory>org.omnifaces.exceptionhandler.FullAjaxExceptionHandlerFactory</exception-handler-factory>
</factory>
500.xhtml
<!DOCTYPE html PUBLIC "-//W3C//DTD XHTML 1.0 Transitional//EN" "http://www.w3.org/TR/xhtml1/DTD/xhtml1-transitional.dtd">
<html xmlns="http://www.w3.org/1999/xhtml"
    xmlns:h="http://xmlns.jcp.org/jsf/html"
    xmlns:ui="http://xmlns.jcp.org/jsf/facelets"
    xmlns:fn="http://xmlns.jcp.org/jsp/jstl/functions"
    xmlns:of="http://omnifaces.org/functions">
    <!--    xmlns:p="http://primefaces.org/ui" -->

<h:head>
	<title>error</title>
</h:head>
<h:body>
	<ul>
    <li>Date/time: #{of:formatDate(now, 'yyyy-MM-dd HH:mm:ss')}</li>
    <li>User agent: #{header['user-agent']}</li>
    <li>User IP: #{request.remoteAddr}</li>
    <li>Request URI: #{requestScope['javax.servlet.error.request_uri']}</li>
    <li>Ajax request: #{facesContext.partialViewContext.ajaxRequest ? 'Yes' : 'No'}</li>
    <li>Status code: #{requestScope['javax.servlet.error.status_code']}</li>
    <li>Exception type: #{requestScope['javax.servlet.error.exception_type']}</li>
    <li>Exception message: #{requestScope['javax.servlet.error.message']}</li>
    <li>Exception UUID: #{requestScope['org.omnifaces.exception_uuid']}</li>
    <li>Stack trace:
        <pre>#{of:printStackTrace(requestScope['javax.servlet.error.exception'])}</pre>
    </li>
</ul>
</h:body>

</html>
Now the full stacktrace of the NPE became visible. It was a null-value item in a p:selectCheckboxMenu (of PrimeFaces) that just made MyFaces not work properly under Websphere.
Sublime Text 3 for Java
03 March 2019
Lately, I have been suprised by the great support for Java in VSCode. It is based on the Language Server Protocol standard. This means, an editor only has to implement the interface to this standard. It can then provide support for intellisense, errors and more for any kind of languages if a language-server for this language comes available. There is no need for baking language-support into each editor. It is provided by the language-server backend. E.g. Eclipse JDT provides a language-server for Java.
The integration of Java in VSCode is great and simple to use. Just follow the steps here.
Just for my understanding, I was interested if I can get it working for Sublime Text 3. It requires some manual steps and not many people will choose this combination; but it is possible.
First you have to get the Java Language Server.
git clone https://github.com/eclipse/eclipse.jdt.ls
cd eclipse.jdt.ls
./mvnw package
The built Jar can be found at eclipse.jdt.ls/org.eclipse.jdt.ls.product/target/repository/plugins/org.eclipse.equinox.launcher_1.5.300.v20190213-1655.jar.
Next, install the LSP package for Sublime Text.
Go to Preferences: LSP Settings and add below config:
{
	"clients":
	{
		"jdtls":
		{
			"enabled": true,
            "command": ["java", "-jar", "/home/daniel/junk/eclipse.jdt.ls/org.eclipse.jdt.ls.product/target/repository/plugins/org.eclipse.equinox.launcher_1.5.300.v20190213-1655.jar", "-configuration", "/home/daniel/junk/eclipse.jdt.ls/org.eclipse.jdt.ls.product/target/repository/config_linux"],
            "scopes": ["source.java"],
            "syntaxes": ["Packages/Java/Java.sublime-syntax"],
            "languageId": "java"
		}
	}
}
Note that I have put in absolute paths and you will have to replace it with yours. You not only need to set the Jar-file but also the path to a config-folder based on your platform.
After this, you are ready to run LSP: Enable Language Server Globally and open a Maven- or Gradle-based project in Sublime. You should see syntax highlighting and intellisense for your .java-files.
Note though that the usability is nothing like Eclipse or Netbeans. Not even close to VSCode. It shows that this is not a editor people use for Java development. Anyway, it was a nice experiment to better understand the integration between a language-client and a language-server.
Arquillian UI Testing from Gradle
01 March 2019
This is an updated version of last year’s post. The main change is that Gradle now has native BOM-support.
Lets for this post assume we want to test some Web UI that is already running somehow. I.e. we don’t want to start up the container with the web-app from arquillian.
So, make sure you have the following in your build.gradle:
apply plugin: 'java'

sourceCompatibility = 1.8
targetCompatibility = 1.8

repositories {
    jcenter()
}

dependencies {
    testCompile 'junit:junit:4.12'

    implementation platform('org.jboss.arquillian:arquillian-bom:1.4.1.Final')
    testCompile "org.jboss.arquillian.junit:arquillian-junit-container"
    testCompile "org.jboss.arquillian.graphene:graphene-webdriver:2.3.2"
}
Now the test:
@RunAsClient
@RunWith(Arquillian.class)
public class HackerNewsIT {

    @Drone
    WebDriver browser;

    @Test
    public void name() {
        browser.get("https://news.ycombinator.com/");
        String title = browser.getTitle();
        Assert.assertThat(title, CoreMatchers.is("Hacker News"));
    }

}
Run with it with gradle test.
By default, HTMLUnit will be used as the browser. To use Chrome, you can set it in the arquillian.xml:
 <arquillian xmlns="http://jboss.com/arquillian" xmlns:xsi="http://www.w3.org/2001/XMLSchema-instance"
    xsi:schemaLocation="http://jboss.org/schema/arquillian http://jboss.org/schema/arquillian/arquillian_1_0.xsd">

    <extension qualifier="webdriver">
        <property name="browser">chrome</property>
        <!--property name="chromeDriverBinary">/home/daniel/dev/tools/chromedriver</property-->
    </extension>

</arquillian>
You don’t need to download the chromedriver manually anymore; but you can: https://sites.google.com/a/chromium.org/chromedriver/WebDriver.
"Watch and Run" shell script
17 February 2019
I am using Python a lot lately for machine learning. To experiment a lot and quickly, I am using a simple shell-script that automatically runs my Python script whenever I change it. This is not only useful for Python but for any task that should be triggered based on a changed file.
war() {
    war_do() {
        clear;
        the_time=$(date +%H:%M:%S)
        start=$(date +%s.%N)
        # Run the command that was provided as argument
        eval $@;
        rc=$?
        end=$(date +%s.%N)
        diff=$(echo "${end} - ${start}" | bc)
        if [ $rc -eq 0 ]; then
            echo ""
            echo -e "\e[2m[${the_time}]\e[0m \e[1;32m** Successful **\e[0m \e[2m(time: ${diff} seconds)\e[0m"
        else
            echo ""
            echo -e "\e[2m[${the_time}]\e[0m \e[1;31m** Failed **\e[0m"
        fi
        sleep 1;
    }
    war_do $@
    while inotifywait -qq .; do
        war_do $@
    done
}
You have to make sure that inotifywait is available on your system.
Assume you source the script in your .bashrc, you can now run below command to contiously run your Python script on each saved change:
war python app.py
Or your NodeJS script:
war node app.js
Arquillian Chameleon with new @GradleBuild-annotation
23 December 2018
In this post and this post I have described how Chameleon can considerably simplify the usage of Arquillian.
What still was missing is the option for Arquillian to build the artifact/WAR with Gradle itself and use it for the test/deployment.
Some time ago I gave it a shot to implement the @GradleBuild-annotation similar to the existing @MavenBuild-annotation.
It took some time until my commit made it into an official release-candidate; but here are the steps how you can make use of it.
Here, I am only listing the updated dependencies for Chameleon:
dependencies {
    testCompile 'org.arquillian.container:arquillian-chameleon-junit-container-starter:1.0.0.CR4'
    testCompile 'org.arquillian.container:arquillian-chameleon-gradle-build-deployment:1.0.0.CR4'
}
Now you can make use of @GradleBuild. It will trigger the Gradle-build via the Tooling-API and use the artifact under build/libs as deployment for the test.
@RunWith(ArquillianChameleon.class)
@GradleBuild
@ChameleonTarget(value = "wildfly:11.0.0.Final:managed")
public class HelloServiceIT {

    @Inject
    private HelloService service;

    @Test
    public void shouldGreetTheWorld() throws Exception {
        Assert.assertEquals("hello", service.hello());
    }
}
Java Code Hot Swapping
21 December 2018
I am constantly suprised that developers who are working with Java for years are not aware of the hot-swapping-code feature of the JVM. In a nutshell, when you run a Java application from within e.g. Eclipse in debug-mode (or connect to a "Remote Java Application") you are able to change the content of your methods during runtime of the application. You are not able to add/remove/change fields or method signatures, but you can change the content of methods. To me, this is a big deal and allows much fast development because enterprise applications can grow big over the years and have deployment-times of minutes instead of seconds. Not having to redeploy for each minor change is a huge time-saver.
Unfortunately, depending on your workflow hot-code-swapping will not always work. And you might get errors like "Hot Code Replace Failed - delete method not implemented" even when you just change the content of your methods. How can this be?
The problem usually is related to the usage of two different Java compilers in your workflow. Say, you are building and deploying your WAR-archive with Maven or Gradle from the commandline and then deploy it to your application-server (e.g. Wildfly). Now, you connect to the application from within Eclipsse via "Remote Debugging" and change your code. Most likely, on the commandline you are using an Oracle or OpenJDK for compilation whereas Eclipse is using it’s own Eclipse Compiler for Java which can generate slightly different bytecode. In reality, problems often happen when your classes use lamdba expressions or anonymous inner classes. The name of the lambda methods or references to the inner classes can be different between the two compilers and during hot-swapping it will look to the debugger as fields or methods have been removed/added.
The solution is two make sure you use the same compiler for the initial compliation and the debugger session. When working with Eclipse and Gradle, this means either
-
Build and deploy your application from within Eclipse via the Server Adapters; this way all is compiled via ECJ.
-
Or use gradle-eclipse-compiler-plugin to use ECJ also for builds from the commandline.
The described approach makes sure that only ECJ is used. I have not found a way yet to do it the other way round; i.e. use javac from within Eclipse.
Deploying Java EE 8 Applications to Heroku
01 November 2018
I am currently developing a simple web-app that is most-likely only used by myself and maybe some friends. It is using Java EE 8 and also has a HTML/JavaScript UI that gives me the possibility to tinker with some modern browser-APIs like WebComponents, Shadow-DOM, etc.
As I like to leverage such hobby-projects to also try and learn new stuff, I was looking for a simple (and cheap) way to host this application in the cloud. Obviously, AWS, Azure, Google Cloud would be options if my focus would be on learning something new with these cloud platforms. But this time I wanted to focus on the actual application and thus use something slightly more developer-friendly. In this post I will show how to deploy a Java EE 8 application on Heroku using TomEE and OpenLiberty.
As there are not many references on the internet that describe how to deploy Java EE applications on Heroku (specifically not an application-server-based deployment), I think this write-up might also be helpful to others.
Procfile and Fat Jar Solutions
From past experience I know that Heroku makes it simple to deploy to the cloud. It integrates nicely with Git and deploying can be as simple as typing git push heroku master. Literally.
Basically, you define a Procfile that tells heroku how to build and deploy the application. If I would want to use a fat-jar solution like PayaraMicro, Thorntail or just repackaging as a fat-jar, this would work easily. Heroku will detect popular build-systems like Maven and Gradle, build the application and the Procfile just needs to contain the command-line to run the Jar. See here for the steps.
This is not an option for me as I want to do the main development on a regular application-server; deploying to production with a different model then what is used in development does not sound like a great idea. Why do the main development on a regular application-server? Because the build is much fast than when it needs to download and package a 50 MB Jar-file.
Docker Container Registry
As Docker playes nicely with Java EE application-servers, the next logical step is to ask if you can somehow host a Docker container on Heroku.
And you can. They have a Docker conatainer registry where you can easily push images. Read the steps here.
The "downside" for me is that it does not have such a nice workflow as you are accustomed to from Heroku. Instead of doing git push heroku master, you now have to build locally or on some other build-server and then you basically do a docker push. This can easily lead to situations where you just start fiddling around and at one point and end with a deployed container that does not respresent a specific commit. I am not saying that this has to be a big problem for a hobby-project but why not aim for a better solution?
Docker-based Build and Deploy via heroku.yml
The service I finally opted for is still in public beta but promises to combine the easy workflow of git push heroku master with Docker.
The idea is to use Docker for building and deploying your application. A heroku.yml is used to define what images to build and what containers run.
The heroku.yml can look as simple as this:
build:
  docker:
    web: Dockerfile
INFO: Note that you can find the whole project on my GitHub repository.
This just means that during the build-stage an image named web will be built based on the Dockerfile in the root of the project. What command will be used to run it? By default, whatever is defined via EXEC in the Dockerfile.
How to set up the Dockerfile? As it is needed to build our application (via Gradle or Maven) and also deploy it, multi-stage builds are the answer.
FROM openjdk:8-jdk-alpine as build
COPY . /usr/src/app
WORKDIR /usr/src/app
RUN ./gradlew build

FROM tomee:8-jre-8.0.0-M1-plume
COPY src/main/tomee/run_tomee.sh /usr/local/
COPY src/main/tomee/config/server.xml /usr/local/tomee/conf/
COPY --from=0 /usr/src/app/build/libs/heroku-javaee-starter.war /usr/local/tomee/webapps/
CMD /usr/local/run_tomee.sh
In the first stage we use a plain OpenJDK-image to build our WAR-file with Gradle.
The second stage is based on an official TomEE base-image and additionally contains the WAR-file built in the first stage.
Note that we also package a dedicated shell-script to start TomEE; and the server.xml is mainly included to read the HTTP-port from an environment-variable.
Heroku works in the following way: When the container is started, an environment-variable named PORT is defined. It is the responsibility of the application to use this port.
For TomEE, I was only able to do this by taking the environment-variable in the Shell and then setting it as a Java system-property which is read in the server.xml. In contrast to this, OpenLiberty directly allows to access environment-variables in its configuration-file (which is coincidentally also called server.xml).
I will assume that you have a general understanding how to build a Java EE WAR-file with Gradle or Maven; there is nothing special here.
Deploy to TomEE on Heroku
Now lets see how we can get this deployed to Heroku.
-
Create an account for Heroku, download/install the Heroku CLI and run
heroku login. -
Get the Heroku Java EE Starter Project from my GitHub Repo.
git clone https://github.com/38leinaD/heroku-javaee-starter.git
cd heroku-javaee-starter
-
Create an application at Heroku and set the Stack so we can work with Docker and the
heroku.yml.heroku create heroku stack:set container
-
And now the only step that you will need to repeat later during development; and it is the reason why it is so nice to work with Heroku in the first place:
git push heroku master
This will push your code to Heroku and trigger the build and deployment of the application.
-
You might remember from earlier that we gave the container the name
webin theheroku.yml. By convention the container with this name is automatically scaled to one instance. If you would name the container differently (let`s assumemyapp), you need to runheroku ps:scale myapp=1manually. Anyway, you can check withheroku pswhat processes/containers are running for your application. -
If you want to see the actual stdout/log of the container starting up, you can use
heroku logs --tail. -
Once the application-server is started, you can run
heroku openand it will open the URL under which your application is deployed on Heroku in your default browser.
Deploy to OpenLiberty on Heroku
What changes are needed to deploy to a different application-server? E.g. OpenLiberty?
For one, a different Dockerfile that packages the WAR into an OpenLiberty container.
The reference which Dockerfile is used can be found in the heroku.yml.
You can simply change it to Dockerfile.liberty if you want to try it out.
As already stated before, the setting of the HTTP-port from an environment-varible can easily be done from OpenLiberty’s server.xml.
To try it out, simply change the heroku.yml and run:
git add heroku.yml
git commit -m "Deploy to OpenLiberty this time."
git push heroku master
You can monitor the startup of OpenLiberty with heroku logs --tail.
Summary
I hope it was possible for me to convience you that using Heroku for deploying Java EE application is an easy option for at least hobby-projects. It only takes seconds to deploy an application and share it with family, friends or testers. :-)
The nice thing about integrating so nicely with Docker and Git, is that you don’t have a lot of proprietary content in your project. Except for the heroku.yml there is nothing. If your application grows, you can easily move to AWS or another cloud-provider.
Building native Java Applications with GraalVM
20 October 2018
Introduction
GraalVM is an experimental JVM featuring a new Just-in-time (JIT) compiler that might some day replace HotSpot. One noteable feature is the ability to also use this JIT to build native applications that do not require a JVM to be installed on the system. It is just a native application like an .exe under Windows.
There are other solutions that allow you to bundle your Java application as a "kind of" native app (e.g. including the JRE in some bundled form), but the native application built by GraalVM has a better performance in in regards to startup-time. Where normal Java applications are slow on startup because the JIT needs to warm up and optimize the code, the native application built by GraalVM is multiple factors of a magnitude faster. In real numbers: On my system, the below application started via java -jar took 200 milliseconds where the native application took 1 millisecond only.
Hello Native
Here are the steps to build and run a simple commandline-app via GraalVM.
|
Important
|
You need to have the native devlopment-tools of your OS installed. For me on CentOS, this is: |
-
glibc-devel
-
zlib-devel
-
gcc
-
glibc-static
-
zlib-static
For Debian Stretch, it is:
-
zlib1g-dev
Now the steps:
-
Get GraalVM. I use SDKMan to download and manage my Java versions. Simply run:
sdk install java 1.0.0-rc7-graal
SDKMan will ask if it should set graal as the default Java-version. I would not do so; rather, set it manually in the current shell:
export JAVA_HOME=/home/daniel/.sdkman/candidates/java/1.0.0-rc7-graal
export PATH="$JAVA_HOME/bin:$PATH"
-
Create a simple Java-project; e.g. via Gradle:
mkdir graal-native && cd graal-native
gradle init --type java-application
-
Build the jar via Gradle:
gradle build
-
Build the native image/application with
native-imageutility from GraalVM.native-image \ -cp build/libs/graal-native.jar \ -H:+ReportUnsupportedElementsAtRuntime \ --static --no-server AppNote that the gradle-build built the standard Jar to
build/libs/graal-native.jar. Also, the fully qualified class-name of the class with the main-method isApp. -
A native executable with the same classname (only lower-case) should have been built. Run it with
./app.
Reflective access
Building a native image from your Java-application will limit the ability to use reflection. Read this for the limitations of GraalVM and where a special JSON-file with metadata is required.
Let’s create a small example in the App class:
import java.lang.reflect.InvocationTargetException;
import java.lang.reflect.Method;

public class App {
	public String getGreeting() {
		return "Hello world.";
	}

	public static void main(String[] args) {
		App app = new App();
		try {
			Method greetMethod = App.class.getMethod("getGreeting", new Class[] {});
			System.out.println(greetMethod.invoke(app, new Object[] {}));
		} catch (NoSuchMethodException | SecurityException | IllegalAccessException | IllegalArgumentException
				| InvocationTargetException e) {
			System.err.println("Something went wrong...");
			e.printStackTrace();
		}

	}
}
Building the JAR and creating a native-image should work like before. Running the app, should also work due to the Automatic detection feature.
It works, because the compiler can intercept the reflection-calls and replace them with the native calls because getGreeting is a constant String.
Let’s see if it will still work when we provide the method-name as a commandline-argument to the application:
import java.lang.reflect.InvocationTargetException;
import java.lang.reflect.Method;

public class App {
	public String getGreeting() {
		return "Hello world.";
	}

	public static void main(String[] args) {
		String methodName = args[0];
		System.out.println("Method accessed reflectively: " + methodName);

		App app = new App();
		try {
			Method greetMethod = App.class.getMethod(methodName, new Class[] {});
			System.out.println(greetMethod.invoke(app, new Object[] {}));
		} catch (NoSuchMethodException | SecurityException | IllegalAccessException | IllegalArgumentException
				| InvocationTargetException e) {
			System.err.println("Something went wrong...");
			e.printStackTrace();
		}

	}
}
We build the native image like before. But running the app will fail:
> ./app getGreeting
Method accessed reflectively: getGreeting
Something went wrong...
java.lang.NoSuchMethodException: App.getGreeting()
	at java.lang.Throwable.<init>(Throwable.java:265)
	at java.lang.Exception.<init>(Exception.java:66)
	at java.lang.ReflectiveOperationException.<init>(ReflectiveOperationException.java:56)
	at java.lang.NoSuchMethodException.<init>(NoSuchMethodException.java:51)
	at java.lang.Class.getMethod(Class.java:1786)
	at App.main(App.java:15)
	at com.oracle.svm.core.JavaMainWrapper.run(JavaMainWrapper.java:163)
Lets create a file called reflectionconfig.json with the necessary meta-information for the App class:
[
  {
    "name" : "App",
    "methods" : [
      { "name" : "getGreeting", "parameterTypes" : [] }
    ]
  }
]
Build the native application with the meta-data file:
native-image \
    -cp build/libs/graal-native.jar \
    -H:ReflectionConfigurationFiles=reflectionconfig.json \
    -H:+ReportUnsupportedElementsAtRuntime \
    --static --no-server App
Run the application again, and you should see it works now:
> ./app getGreeting
Method accessed reflectively: getGreeting
Hello world.
Conclusion
GraalVM is certainly a nice piece of research. Actually, more than that; according to Top 10 Things To Do With GraalVM, it is used in production by Twitter. I will be trying out the native integration with JavaScript/NodeJS in a future post. As this post is mainly for my own records, I might have skimmed over some important details. You might want to read this excellent article to run netty on GraalVM for a more thorough write-up.
Using Java Annotation Processors from Gradle and Eclipse
14 October 2018
This post describes how to use/reference a Java Annotation Processor from your Gradle-based Java project. The main challenge is the usage from within Eclipse which requires some additional steps.
Let’s assume we want to use Google’s auto-service annotation-processor which generates META-INF/services/ files based on annotation service-providers with @AutoService annoations.
Basic Setup
Adjust your build.gradle to reference the Gradle APT plugin and add a dependency.
plugins {
    id "net.ltgt.apt-eclipse" version "0.18"
}

dependencies {
	annotationProcessor ('com.google.auto.value:auto-value:1.5')
}
The plugin net.ltgt.apt-eclipse will also pull in net.ltgt.apt (which is independent of any IDE) and the standard eclipse plugin.
The annotation-processor is now properly called during compilation if you run gradle build. The only problem left is how to run it from within Eclipse.
Eclipse Integration
If you carefully check the README.md, you will see that when using the Buildship plugin in Eclipse (which should be the default because Eclipse ships with it) you have to perform some manual steps:
When using Buildship, you’ll have to manually run the eclipseJdtApt and eclipseFactorypath tasks to generate the Eclipse configuration files, then either run the eclipseJdt task or manually enable annotation processing: in the project properties → Java Compiler → Annotation Processing, check Enable Annotation Processing. Note that while all those tasks are depended on by the eclipse task, that one is incompatible with Buildship, so you have to explicitly run the two or three aforementioned tasks and not run the eclipse task.
What you have to do, is run the following command on your project:
gradle eclipseJdtApt eclipseFactorypath eclipseJdt
From within Eclipse, you now have to run right-click the project and select Gradle / Refresh Gradle Project. Afterwards, Project / Clean.
With this clean build, the annotation-processor should be running.
In case it does not work, you can double-check if the project was configured properly by right-clicking the project and going to Properties / Java Compiler / Annotation Processing / Factory Path; the auto-value JAR-file should be referenced here.
At this point, your annotation-processor should work fine; also from within Eclipse. But in case your annotation-processor is generating Java classes, you will not see them in Eclipse because they are generated to build/generated/sources/apt/main.
I have found two ways to deal with it.
-
Either, generate them to
src/main/generatedin case you have some need to also check them in source-control.compileJava { options.annotationProcessorGeneratedSourcesDirectory = file("${projectDir}/src/main/generated") } -
Or, make the build-subfolder a source-folder in Eclipse:
eclipse {
    classpath {
        file.beforeMerged { cp ->
            cp.entries.add( new org.gradle.plugins.ide.eclipse.model.SourceFolder('build/generated/source/apt/main', null) )
        }
    }
}
In the future, I want to be able to quickly write an annotation-processor when needed. I have put a Gradle project containing a minimal annotation-processor including unit-test in my Github repo.
JEP 330: Launch Single-File Source-Code Programs
24 September 2018
Java 11 includes JEP 330 which allows to use Java source-files like shell-scripts.
Create a file named util with the following content:
#!java --source 11

public class Util {
	public static void main (String[] args) {
		System.out.println("Hello " + args[0] + "!");
	}
}
Make sure it is executable by running chmod u+x util.
Running the script, will compile it on the fly:
> ./util Daniel
Hello Daniel!
As of now, editors like Visual Studio code don’t recognize the file as Java files automatically. This means, code-completion and syntax hightlighting do not work without manual steps. Let’s hope this gets fixed soon after the release of Java 11.
OpenJFX 11
23 September 2018
As of Java 11, JavaFX is no longer packaged with the runtime but is a seperate module. Go to the OpenJFX website for "Getting Started" docs. In this post, I will provide a minimal setup for building and testing a OpenFX 11 application. The purpose is not to describe the steps in detail, but to have some Gradle- and code-samples at hand for myself.
Of course, you will need Java 11. As of this writing, Java 11 is not released so you will need to get an early-access version.
The Application-class looks like this:
package sample;

import java.io.IOException;

import javafx.application.Application;
import javafx.fxml.FXML;
import javafx.fxml.FXMLLoader;
import javafx.scene.Parent;
import javafx.scene.Scene;
import javafx.scene.control.Button;
import javafx.scene.control.Label;
import javafx.scene.control.TextField;
import javafx.stage.Stage;

public class HelloFX extends Application {

	public static class Controller {

		@FXML
		TextField inputField;

		@FXML
		Label label;

		@FXML
		Button applyButton;

		public void applyButtonClicked() {
			label.setText(inputField.getText());
		}
	}

	@Override
	public void start(Stage stage) throws IOException {
		Parent root = FXMLLoader.load(getClass().getResource("/sample.fxml"));
		Scene scene = new Scene(root, 640, 480);
		stage.setScene(scene);
		stage.show();
	}

	public static void main(String[] args) {
		launch();
	}
}
The controller is embeeded to simplify the example. It is used from within the sample.fxml under src/main/resources.
<?xml version="1.0" encoding="UTF-8"?>

<?import javafx.scene.control.Button?>
<?import javafx.scene.control.Label?>
<?import javafx.scene.control.TextField?>
<?import javafx.scene.layout.ColumnConstraints?>
<?import javafx.scene.layout.GridPane?>
<?import javafx.scene.layout.RowConstraints?>

<GridPane alignment="center" hgap="10" vgap="10" xmlns="http://javafx.com/javafx/10.0.1" xmlns:fx="http://javafx.com/fxml/1" fx:controller="sample.HelloFX$Controller">
   <children>
            <TextField id="input" fx:id="inputField" layoutX="15.0" layoutY="25.0" />
            <Label id="output" fx:id="label" layoutX="15.0" layoutY="84.0" text="TEXT GOES HERE" GridPane.rowIndex="1" />
            <Button id="action" fx:id="applyButton" layoutX="124.0" layoutY="160.0" mnemonicParsing="false" onAction="#applyButtonClicked" text="Apply" GridPane.rowIndex="2" />
   </children>
   <columnConstraints>
      <ColumnConstraints />
   </columnConstraints>
   <rowConstraints>
      <RowConstraints />
      <RowConstraints minHeight="10.0" prefHeight="30.0" />
      <RowConstraints minHeight="10.0" prefHeight="30.0" />
   </rowConstraints>
</GridPane>
Of course, we want to write tested code. So, we can write a UI-test using TestFX.
package sample;

import java.io.IOException;

import org.junit.jupiter.api.Test;
import org.testfx.api.FxAssert;
import org.testfx.framework.junit5.ApplicationTest;
import org.testfx.matcher.control.LabeledMatchers;

import javafx.stage.Stage;

public class HelloFXTest extends ApplicationTest {

	@Override
	public void start(Stage stage) throws IOException {
		new HelloFX().start(stage);
	}

	@Test
	public void should_drag_file_into_trashcan() {
		// given:
		clickOn("#input");
		write("123");

		// when:
		clickOn("#action");

		// then:
		FxAssert.verifyThat("#output", LabeledMatchers.hasText("123"));
	}
}
Now, the build.gradle that ties it all together.
apply plugin: 'application'

def currentOS = org.gradle.internal.os.OperatingSystem.current()
def platform
if (currentOS.isWindows()) {
    platform = 'win'
} else if (currentOS.isLinux()) {
    platform = 'linux'
} else if (currentOS.isMacOsX()) {
    platform = 'mac'
}

repositories {
    mavenCentral()
}

dependencies {
    // we need to depend on the platform-specific libraries of openjfx
    compile "org.openjfx:javafx-base:11:${platform}"
    compile "org.openjfx:javafx-graphics:11:${platform}"
    compile "org.openjfx:javafx-controls:11:${platform}"
    compile "org.openjfx:javafx-fxml:11:${platform}"

    // junit 5
    testImplementation 'org.junit.jupiter:junit-jupiter-api:5.3.1'
    testRuntimeOnly 'org.junit.jupiter:junit-jupiter-engine:5.3.1'

    // testfx with junit5 binding
    testImplementation 'org.testfx:testfx-core:4.0.14-alpha'
    testImplementation 'org.testfx:testfx-junit5:4.0.14-alpha'
}

// add javafx modules to module-path during compile and runtime
compileJava {
    doFirst {
        options.compilerArgs = [
                '--module-path', classpath.asPath,
                '--add-modules', 'javafx.controls,javafx.fxml'
        ]
    }
}

run {
    doFirst {
        jvmArgs = [
                '--module-path', classpath.asPath,
                '--add-modules', 'javafx.controls,javafx.fxml'
        ]
    }
}

test {
    // use junit5 engine in gradle
    useJUnitPlatform()
    // log all tests
    testLogging {
        events 'PASSED', 'FAILED', 'SKIPPED'
    }
    // log output of tests; enable when needed
    //test.testLogging.showStandardStreams = true
}

mainClassName='sample.HelloFX'
Some comments are give as part of the code. So, no further explaination is give here.
Execute gradle test to run the tests. Execute gradle run to just run the application.
KumuluzEE for Standalone Java EE Microservices
09 September 2018
I have to admit that I have never been too excited about frameworks like KumuluzEE, Thorntail (previously Wildfly Swarm), Payara Micro, etc.. Regular application-servers that offer a seperation between platform and application-logic feel more natural; even more so now with Docker as it can reduce the image-size significantly.
But in certain situation I can see that it is useful to have a standalone Java application which can be started with java -jar instead of requiring an application-server. Due to this reason, I felt the need to give these frameworks/platforms a try.
In this post, I would like to start with KumuluzEE which advertises the easy migration of Java EE applications to cloud-native microservices on it’s website. The advantage, like with Thorntail, to me is that I can code against the regular Java EE APIs and thus do not have to learn a new framework.
Below, I will describe the main things that need to be done to a Maven-based Java EE project to migrate it to KumuluzEE. You can find the final version of the project in my Git repo.
Steps
As the generated artifact is an Uber-Jar and no WAR-file, change the packaging-type to 'jar'.
<packaging>jar</packaging>Add the dependencies to KumuluzEE and remove the dependency to the Java EE APIs (they will be transitively included). This is already what I don’t like at all: I will have to fiddle with and include each Java EE spec individually; no way to just depend on all parts of the spec.
<dependencies>
    <dependency>
        <groupId>com.kumuluz.ee</groupId>
        <artifactId>kumuluzee-core</artifactId>
    </dependency>
    <dependency>
        <groupId>com.kumuluz.ee</groupId>
        <artifactId>kumuluzee-servlet-jetty</artifactId>
    </dependency>
    <dependency>
        <groupId>com.kumuluz.ee</groupId>
        <artifactId>kumuluzee-jsp-jetty</artifactId>
    </dependency>
    <dependency>
        <groupId>com.kumuluz.ee</groupId>
        <artifactId>kumuluzee-el-uel</artifactId>
    </dependency>
    <dependency>
        <groupId>com.kumuluz.ee</groupId>
        <artifactId>kumuluzee-jax-rs-jersey</artifactId>
    </dependency>
    <dependency>
        <groupId>com.kumuluz.ee</groupId>
        <artifactId>kumuluzee-cdi-weld</artifactId>
    </dependency>
    <dependency>
        <groupId>com.kumuluz.ee</groupId>
        <artifactId>kumuluzee-jsf-mojarra</artifactId>
    </dependency>
    <dependency>
        <groupId>com.kumuluz.ee</groupId>
        <artifactId>kumuluzee-jpa-eclipselink</artifactId>
    </dependency>
    <dependency>
        <groupId>com.kumuluz.ee</groupId>
        <artifactId>kumuluzee-bean-validation-hibernate-validator</artifactId>
    </dependency>
    <dependency>
        <groupId>com.kumuluz.ee</groupId>
        <artifactId>kumuluzee-json-p-jsonp</artifactId>
    </dependency>
    <dependency>
        <groupId>com.kumuluz.ee</groupId>
        <artifactId>kumuluzee-jta-narayana</artifactId>
    </dependency>
    <dependency>
        <groupId>com.kumuluz.ee</groupId>
        <artifactId>kumuluzee-microProfile-1.2</artifactId>
    </dependency>
</dependencies>
<dependencyManagement>
    <dependencies>
        <dependency>
            <groupId>com.kumuluz.ee</groupId>
            <artifactId>kumuluzee-bom</artifactId>
            <version>3.0.0-SNAPSHOT</version>
            <type>pom</type>
            <scope>import</scope>
        </dependency>
    </dependencies>
</dependencyManagement>
As the application is packaged as a JAR-file and not as WAR, there is a different structure required in the build already. Instead of having a src/main/webapp, you have to place it under src/main/resources/webapp. Also, files like beans.xml and persistence.xml have to be placed under src/main/resources/META-INF instead of src/main/resources/webapp/WEB-INF. Below you find the basic structure.
.
└── src
    └── main
        ├── java
        └── resources
            ├── META-INF
            │   └─ beans.xml
            └── webapp
                ├── index.xhtml
                └── WEB-INF
                    ├── faces-config.xml
                    └── web.xml
I also had to remove the usage of EJB’s as they are not available in KumuluzEE; which is understandable as it is a big specification and is step-by-step replaced by CDI-based mechanisms like @Transactional.
It took me quiet some fiddeling to get the app running; one of my main issues was that I had Jersey as transitive dependency for KumuluzEE and also as a test-dependency (as a test-client to invoke the JAX-RS endpoint). The version difference influenced the versions in my Uber-Jar. In the end, I see this as a problem in Maven, but nevertheless, this would not have happend when just coding against the JavaEE API and deploying on an app-server.
Before all the Maven fiddeling, I also tried to create a KumuluzEE-compatible Uber-Jar with Gradle but gave up. I created an issue and move on to Maven instead.
Once I had all my issues resolved, the application itself was running smoothly. Having gone through the motions once, I feel like it could be a viable alternative for developing small microservice or standalone-apps that can be sold/packaged as products but should not require the installation of an app-server.
I also appreciate the availability of extensions like service discovery with Consul, access-management with KeyCloak, streaming with Kafka and full support for Microprofile 1.2. For sure, I will consider it the next time I feel the need for developing a small/standalone Java application. Small is relative though; creating the Uber-Jar and using CDI, JAX-RS, JSF and JPA add roughly 26 MB to the application.
Building Self-Contained and Configurable Java EE Applications
25 June 2018
In this post I would like to outline how to build a self-contained Java EE application (WAR), including JPA via a custom JDBC-driver, but with zero application-server configuration/customizing. The goal is to drop the Java EE application into a vanilla application-server. Zero configuration outside the WAR-archive. I will be using the latest Java EE 8-compliant application-servers but that does not mean you cannot use a Java EE 7-compliant server.
To achieve our goal, I will be leveraging a feature of Java EE 7 that I always found interesting but did not use very often due to it’s limitations: @DatasourceDefinition.
It is a way of declaring a datasource and connection-pool within your application via annotation; instead of having to configure it outside the application via non-portable configuration-scripts for the application-server of your choice.
E.g. on JBoss you would usually configure your datasource in the standalone*.xml; either directly or via a JBoss .cli-script.
Below you find an example how to define a datasource via annotation in a portable way:
@DataSourceDefinition(
        name = "java:app/jdbc/primary",
        className = "org.postgresql.xa.PGXADataSource",
        user = "postgres",
        password = "postgres",
        serverName = "localhost",
        portNumber = 5432,
        databaseName = "postgres")
To me, this was seldom useful because you hard-code your database-credentials. There has been a proposal for Java EE 7 to support password-aliasing, but it never made it into the spec. In the past, I only used it for small applications and proof-of-concepts.
Until now! A twitter-discussion lead me to realize that at least Wildfly and Payara come with vendor-specific features to do variable-replaments in the annotation-values. But lets start from the beginning.
Datasource-definition and JPA
Below you find a useful pattern to define and produce a datasource within your application:
@Singleton
@DataSourceDefinition(
        name = "java:app/jdbc/primary",
        className = "org.postgresql.xa.PGXADataSource",
        user = "postgres",
        password = "postgres",
        serverName = "postgres",
        portNumber = 5432,
        databaseName = "postgres",
        minPoolSize = 10,
        maxPoolSize = 50)
public class DatasourceProducer {

	@Resource(lookup="java:app/jdbc/primary")
	DataSource ds;

	@Produces
	public DataSource getDatasource() {
		return ds;
	}
}
The @DatasourceDefinition annotation is sufficient here to bind the datasource for PostgreSQL under the global JNDI-name java:app/jdbc/primary.
The usage of @Resource and @Produces is just additional code that exposes the datasource and makes it injectable in other managed beans via @Inject Datasource ds.
But for JPA, this is not needed. What we need is a persistence.xml that uses the same JNDI-name:
<?xml version="1.0" encoding="UTF-8"?>
<persistence
    version="2.1"
    xmlns="http://xmlns.jcp.org/xml/ns/persistence"
    xmlns:xsi="http://www.w3.org/2001/XMLSchema-instance"
    xsi:schemaLocation="http://xmlns.jcp.org/xml/ns/persistence http://xmlns.jcp.org/xml/ns/persistence/persistence_2_1.xsd">
    <persistence-unit name="DefaultPU" transaction-type="JTA">
        <jta-data-source>java:app/jdbc/primary</jta-data-source>
        <exclude-unlisted-classes>false</exclude-unlisted-classes>
        <properties>
            <property name="javax.persistence.schema-generation.database.action" value="drop-and-create" />
            <property name="javax.persistence.schema-generation.scripts.action" value="drop-and-create" />
            <property name="javax.persistence.schema-generation.scripts.create-target" value="schemaCreate.ddl" />
            <property name="javax.persistence.schema-generation.scripts.drop-target" value="schemaDrop.ddl" />

            <property name="eclipselink.logging.level.sql" value="FINE" />
            <property name="eclipselink.logging.level" value="FINE" />

            <property name="hibernate.show_sql" value="true" />
            <property name="hibernate.format_sql" value="true" />
        </properties>
    </persistence-unit>
</persistence>
From here on, it is plain JPA: Define some entity and inject the EntityManager via @PersistenceContext EntityManager em; to interact with JPA.
Packaging of the JDBC-driver
You might have noticed that the @DataSourceDefinition references the JDBC-driver-class org.postgresql.xa.PGXADataSource.
Obviously, it has to be available for the application so it can connect to the database.
This can be achieved by placing the JDBC-driver in the application-server. E.g. under Wildfly, you register the JDBC-driver as a module.
But what we want is a self-contained application where the JDBC-driver is coming within the application’s web-archive (WAR).
This is very simple to achieve by adding a runtime-dependency to to the JDBC-driver. You favorite build-tool should support it.
In Gradle, it is done like this:
dependencies {
    providedCompile 'javax:javaee-api:8.0'
    runtime 'org.postgresql:postgresql:9.4.1212'
}
Dynamic Configuration
What we have now is a self-contained Java EE application-archive (WAR) but the connection to the database and the credentials are hard-coded in the annotation-properties. To make this really useful, we have to be able to overwrite this values for each stage and deployment. I.e. the database-credentials to the QA-environment’s database will be different than for production. Unfortunately, there is no portable/standard way. But if you are willing to commit to a specific application-server, it is possible. A Twitter-discussion lead me to the documentation for Payara and Wildfly both supporting this feature in some way.
Payara
For Payara here is the Documentation: https://t.co/jQMOMVLy3N
— Felipe Moraes (@fe_amoraes) June 12, 2018
I think I saw something in Wildfly docs, but I’m not sure
So, for Payara we find the documentation here. Note that we will have to modify the annotation-values like this to read from environment variables:
@DataSourceDefinition(
        name = "java:app/jdbc/primary",
        className = "org.postgresql.xa.PGXADataSource",
        user = "${ENV=DB_USER}",
        password = "${ENV=DB_PASSWORD}",
        serverName = "${ENV=DB_SERVERNAME}",
        portNumber = 5432,
        databaseName = "${ENV=DB_DATABASENAME}",
        minPoolSize = 10,
        maxPoolSize = 50)
You can find this as a working Gradle-project plus Docker-Compose environment on Github. The steps are very simple:
git clone https://github.com/38leinaD/jee-samples.git
cd jee-samples/datasource-definition/cars
./gradlew build
docker-compose -f docker-compose.payara.yml up
When the server is started, you can send below request to create a new row in a database-table:
curl -i -X POST -d '{"model": "tesla"}' -H "Content-Type: application/json" http://localhost:8080/cars/resources/cars
If you are wondering where the values like ${ENV=DB_USER} are set, check the docker-compose.payara.yml.
Widlfly
So, how about Wildfly?
For WildFly, see annotation-property-replacement here: https://t.co/UCGVlNVJkj
— OmniFaces (@OmniFaces) June 12, 2018
For Wildfly, you can find it under "Annotation Property Replacement" in the admin-guide.
First, we have to enable the variable-replacement feature in the standalone*.xml; which is not the case by default.
<subsystem xmlns="urn:jboss:domain:ee:4.0">
    <annotation-property-replacement>true</annotation-property-replacement>
    <!-- ... -->
</subsystem>
So, technically, we still hava to modify the application-server in the standalone*.xml in this case.
But then, you can use annotation-properties in the format ${<environment-variable>:<default-value>}:
@DataSourceDefinition(
    name = "java:app/jdbc/primary",
    className = "org.postgresql.xa.PGXADataSource",
    user = "${DB_USER:postgres}",
    password = "${DB_PASSWORD:postgres}",
    serverName = "${DB_SERVERNAME:postgres}",
    portNumber = 5432,
    databaseName = "${DB_DATABASENAME:postgres}",
    minPoolSize = 10,
    maxPoolSize = 50)
If you try this, you might notice the following exception:
Caused by: org.postgresql.util.PSQLException: FATAL: role "${DB_USER:postgres}" does not exist
	at org.postgresql.core.v3.QueryExecutorImpl.receiveErrorResponse(QueryExecutorImpl.java:2455)
	at org.postgresql.core.v3.QueryExecutorImpl.readStartupMessages(QueryExecutorImpl.java:2586)
	at org.postgresql.core.v3.QueryExecutorImpl.<init>(QueryExecutorImpl.java:113)
	at org.postgresql.core.v3.ConnectionFactoryImpl.openConnectionImpl(ConnectionFactoryImpl.java:222)
	at org.postgresql.core.ConnectionFactory.openConnection(ConnectionFactory.java:52)
	at org.postgresql.jdbc.PgConnection.<init>(PgConnection.java:216)
	at org.postgresql.Driver.makeConnection(Driver.java:404)
	at org.postgresql.Driver.connect(Driver.java:272)
	at java.sql.DriverManager.getConnection(DriverManager.java:664)
	at java.sql.DriverManager.getConnection(DriverManager.java:247)
	at org.postgresql.ds.common.BaseDataSource.getConnection(BaseDataSource.java:86)
	at org.postgresql.xa.PGXADataSource.getXAConnection(PGXADataSource.java:48)
	at org.jboss.jca.adapters.jdbc.xa.XAManagedConnectionFactory.getXAManagedConnection(XAManagedConnectionFactory.java:515)
	... 133 more
It seems there is a bug in the latest Wildfly that does not allow to use variables for the user/password properties. For now, we will continue with user and password beeing hardcoded and only the serverName and databaseName as dyanmic values:
@DataSourceDefinition(
    name = "java:app/jdbc/primary",
    className = "org.postgresql.xa.PGXADataSource",
    user = "postgres",
    password = "postgres",
    serverName = "${DB_SERVERNAME:postgres}",
    portNumber = 5432,
    databaseName = "${DB_DATABASENAME:postgres}",
    minPoolSize = 10,
    maxPoolSize = 50)
This works without any issues if the defaults match your environment. Explicitly overwriting these values can be achived via Java’s system-properties. E.g -DDB_SERVERNAME=postgres1 on the commandline.
See docker-compose.wildfly.yml for a complete example.
Before you can run this Wildfly-setup in the demo-application, you need to comment in the right annotation in DatasourceProducer.java. The default setup is for Payara.
Liberty
Liberty does not have support for variables yet, but there is interest and an issue has been filed:
No, interesting idea so I raised an issue: https://t.co/hAvZnU8opO
— Alasdair (@nottycode) June 13, 2018
Conclusion
If you make a choice for either Payara or Wildfly, you are able to build a truely self-contained Java EE application. We have seen how to achive this for a WAR-archive leveraging JPA or plain JDBC. The JDBC-driver is contained within the WAR-archive and configuration for the datasources can be inject from the outside via environment variables or Java system-properties.
Payara and Wildfly offer slightly different mechanisms and syntax. Payara shines because it does not require any additional application-server config. But we cannot specify defaults in the annotation-values and always need to provide environment-variables from the outside.
Wildfly allows to set default-values on the annotation-properties. This makes it possible to deploy e.g. in a development-environment without the need to set any environment-variables. A minor disadvantage is that the default configuration does not have the annotation-property-replacement enabled. So, the only vendor-specific config that is required is the enabling of this feature. Also, currently this mechanism is riddled by a bug. Overwriting the user/password is not working at the time of writing.
With this, both application-servers offer a useful feature for cloud-native applications. Unfortunately, you have to decide for a specific application-server to leverage it. But standardization-efforts are already on their way. The above discussion on Twitter has already been brought over to the Jakarta EE mailing-list. Feel free to join the discussion if you think this is a useful feature that should be standardized.
Post Mortem
Some time after writing this article, I notices that the OmniFaces library comes with a nice workaround via a wrapper datasource that reads all the wrapped datasource’s configuration from a config-file.
data-source in web.xml or @DataSourceDefinition on a class, then use property replacements for some of the attributes (${name} syntax), or without property replacement but with wrapper datasource:https://t.co/bMWedsyI0r
— OmniFaces (@OmniFaces) July 26, 2018
Arjan Tijms, who is one of the creators of the library, has described the implementation in detail on his blog.
Checkstyle Configuration from External JAR
23 June 2018
In a previous post I have described the minimal configuration to get checkstyle working with Gradle.
What i did not like, is that I have to place the checkstyle.xml in my project.
Assuming I stick with the standard checkstyle.xml from Google or Sun (or I have a corporate one), I do no want to place it in each and every repo.
What I found now is that Gradle supports referencing resources from within published artifacts.
In the below configuration, the google_checks.xml is referenced from the published artifact com.puppycrawl.tools:checkstyle:8.10.1 directly.
apply plugin: 'checkstyle'

configurations {
    checkstyleConfig
}
def versions = [
    checkstyle: '8.10.1',
]
dependencies {
    checkstyleConfig ("com.puppycrawl.tools:checkstyle:${versions.checkstyle}") {
        transitive = false
    }
}
checkstyle {
    showViolations = true
    ignoreFailures = false
    toolVersion = "${versions.checkstyle}"
    config = resources.text.fromArchiveEntry(configurations.checkstyleConfig, 'google_checks.xml')
}
The example is derived from the offical gradle docs.
Even simpler Arquillian Chameleon usage with Gradle
11 June 2018
In a previous post I have described how easy it has become to use Arquillian via the Chameleon extension.
The only "complex" part that’s left is the @Deployment-annotated method specificing the deployment via Shrinkwrap.
What exists for this is the @MavenBuild-annotation. It allows to trigger a maven-build and use the generated artifact.
Usually, this would be the regularly built EAR or WAR-file as the deployment; which is fine in a lot of situations.
Unfortunately, there is no @GradleBuild-annotation today. But there is the @File-annotation to just reference any EAR or WAR on the filesystem;
assuming it was previously built by the Gradle-build, we can just reference the artifact.
@RunWith(ArquillianChameleon.class)
@File("build/libs/hello.war")
@ChameleonTarget(value = "wildfly:11.0.0.Final:managed")
public class HelloServiceIT {

    @Inject
    private HelloService service;

    @Test
    public void shouldGreetTheWorld() throws Exception {
        Assert.assertEquals("hello", service.hello());
    }
}
Note that there is no @Deployment-annotated method.
The build/libs/hello.war is built with the normal Gradle build task. If we set up our integrationTest-task like this, we can require the build-task as a dependency:
test {
    // Do not run integration-tests having suffix 'IT'
    include '**/*Test.class'
}

dependencies {
    testCompile 'org.arquillian.container:arquillian-chameleon-junit-container-starter:1.0.0.CR2'
    testCompile 'org.arquillian.container:arquillian-chameleon-file-deployment:1.0.0.CR2'
}

task integrationTest(type: Test) {
    group 'verification'
    description 'Run integration-tests'
    dependsOn 'build'
    include '**/*IT.class'
}
Run it with gradle integrationTest.
If you are wondering what other containers are supported and can be provided via the @ChameleonTarget-annotation, see here for the list.
The actual config of supported containers is located in a file called containers.yaml.
Conclusion
The only disadvantage right now is that it will only work as expected when running a full gradle integrationTest.
If you are e.g. in Eclipse and trigger a single test, it will simply use the already existing artifact instead of creating/building it again.
This is what @MavenBuild is doing; and I hope we will get the equivalent @GradleBuild as well soon.
Websphere Liberty, EclipseLink and Caching in the Cluster
04 June 2018
Cache Coordination
When using JPA, sooner or later the question of caching will arise to improve performance.
Especially for data that is frequently read but only written/updated infrequently, it makes sense to enable the second-level cache via shared-cache-mode-element in the persistence.xml.
See the Java EE 7 tutorial for details.
By default, EclipseLink has the second-level cache enabled as you can read here. Consider what will happen in a clustered environment: What happens if server one has the entity cached and server two will update the entity? server one will have a stale cache-entry and by default noone will tell the server that its cache is out-of-date. How to deal with it? Define a hard-coded expiration? Or not use the second-level-cache at all?
A better solution is to get the second-level caches sychronized in the cluster. EclipseLink’s vendor-specific feature for this is called cache-coordination. You can read more about it here, but in a nutshell you can use either JMS, RMI or JGroups to distribute cache-invalidations/updates within the cluster. This post focuses on getting EclipseLink’s cache-coordination working under Websphere Liberty via JGroups.
Application Configuration
From the application’s perspective, you only have to enable this feature in the persistence.xml via
<property name="eclipselink.cache.coordination.protocol" value="jgroups" />Liberty Server Configuration with Global Library
Deploying this application on Webspher Liberty, will lead to the following error:
Exception Description: ClassNotFound: [org.eclipse.persistence.sessions.coordination.jgroups.JGroupsTransportManager] specified in [eclipselink.cache.coordination.protocol] property.
Thanks to the great help on the openliberty.io mailing-list, I was able to solve the problem. You can read the full discussion here.
The short summary is that the cache-coordination feature of EclipseLink using JGroups is an extension and Liberty does not ship this extension by default. RMI and JMS are supported out-of-the-box but both have disadvantages:
-
RMI is a legacy technology that I have not worked with in years.
-
JMS in general is a great technology for asychroneous communication but it requires a message-broker like IBM MQ or ActiveMQ. This does not sound like a good fit for a caching-mechanism.
This leaves us with JGroups. The prefered solution to get JGroups working is to replace the JPA-implementation with our own. For us, this will simply be EclipseLink but including the extension.
In Liberty this is possible via the jpaContainer feature in the server.xml. The offical documentation describes how to use our own JPA-implementation.
As there are still a few small mistakes you can make on the way, let me describe the configuration that works here in detail:
-
Assuming you are working with the
javaee-7.0-feature in theserver.xml(or in specificjpa-2.1), you will have to get EclipseLink 2.6 as this implements JPA 2.1. Forjavaee-8.0(or in specificjpa-2.2) it would be EclipseLink 2.7.I assume
javaee-7.0here; that’s why I downloaded EclipseLink 2.6.5 OSGi Bundles Zip. -
Create a folder
lib/globalwithin your Liberty server-config-folder. E.g.defaultServer/lib/globaland copy the following from the zip (same as referenced here plus the extension):-
org.eclipse.persistence.asm.jar -
org.eclipse.persistence.core.jar -
org.eclipse.persistence.jpa.jar -
org.eclipse.persistence.antlr.jar -
org.eclipse.persistence.jpa.jpql.jar -
org.eclipse.persistence.jpa.modelgen.jar -
org.eclipse.persistence.extension.jar
-
-
If you would use it like this, you will find a ClassNotFoundException later for the actual JGroups implementation-classes. You will need to get it seperately from here.
If we look on the
2.6.5-tag in EclipseLink’s Git Repo, we see that we should useorg.jgroups:jgroups:3.2.8.Final.Download it and copy the
jgroups-3.2.8.Final.jarto thelib/globalfolder as well. -
The last step is to set up your
server.xmllike this:<?xml version="1.0" encoding="UTF-8"?> <server description="new server"> <!-- Enable features --> <featureManager> <feature>servlet-3.1</feature> <feature>beanValidation-1.1</feature> <feature>ssl-1.0</feature> <feature>jndi-1.0</feature> <feature>jca-1.7</feature> <feature>jms-2.0</feature> <feature>ejbPersistentTimer-3.2</feature> <feature>appSecurity-2.0</feature> <feature>j2eeManagement-1.1</feature> <feature>jdbc-4.1</feature> <feature>wasJmsServer-1.0</feature> <feature>jaxrs-2.0</feature> <feature>javaMail-1.5</feature> <feature>cdi-1.2</feature> <feature>jcaInboundSecurity-1.0</feature> <feature>jsp-2.3</feature> <feature>ejbLite-3.2</feature> <feature>managedBeans-1.0</feature> <feature>jsf-2.2</feature> <feature>ejbHome-3.2</feature> <feature>jaxws-2.2</feature> <feature>jsonp-1.0</feature> <feature>el-3.0</feature> <feature>jaxrsClient-2.0</feature> <feature>concurrent-1.0</feature> <feature>appClientSupport-1.0</feature> <feature>ejbRemote-3.2</feature> <feature>jaxb-2.2</feature> <feature>mdb-3.2</feature> <feature>jacc-1.5</feature> <feature>batch-1.0</feature> <feature>ejb-3.2</feature> <feature>json-1.0</feature> <feature>jaspic-1.1</feature> <feature>distributedMap-1.0</feature> <feature>websocket-1.1</feature> <feature>wasJmsSecurity-1.0</feature> <feature>wasJmsClient-2.0</feature> <feature>jpaContainer-2.1</feature> </featureManager> <basicRegistry id="basic" realm="BasicRealm"> </basicRegistry> <httpEndpoint id="defaultHttpEndpoint" httpPort="9080" httpsPort="9443" /> <applicationManager autoExpand="true"/> <jpa defaultPersistenceProvider="org.eclipse.persistence.jpa.PersistenceProvider"/> </server>
Some comments on the server.xml:
-
Note that we have to list all of the features that are included in the
javaee-7.0feature minus thejpa-2.1feature explicitly now because we don`t want the default JPA-provider. -
Instead of
jpa-2.1I addedjpaContainer-2.1to bring our own JPA-provider. -
The
defaultPersistenceProviderwill set the JPA-provider to use ours and is required by thejpaContainerfeature.
Liberty Configuration without Global Library
Be aware that there are different ways how to include our EclipseLink library. Above, I chose the way that requires the least configuration in the server.xml and also works for dropin-applications. The way I did it was via a global library.
The offical documentation defines it as an explicit library in the server.xml and reference it for each invidual application like this:
<bell libraryRef="eclipselink"/>
<library id="eclipselink">
	<file name="${server.config.dir}/jpa/org.eclipse.persistence.asm.jar"/>
	<file name="${server.config.dir}/jpa/org.eclipse.persistence.core.jar"/>
	<file name="${server.config.dir}/jpa/org.eclipse.persistence.jpa.jar"/>
	<file name="${server.config.dir}/jpa/org.eclipse.persistence.antlr.jar"/>
	<file name="${server.config.dir}/jpa/org.eclipse.persistence.jpa.jpql.jar"/>
	<file name="${server.config.dir}/jpa/org.eclipse.persistence.jpa.modelgen.jar"/>

	<file name="${server.config.dir}/jpa/org.eclipse.persistence.extension.jar"/>
	<file name="${server.config.dir}/jpa/jgroups.jar"/>
</library>

<application location="myapp.war">
    <classloader commonLibraryRef="eclipselink"/>
</application>
Also note, that the JARs are this time in the defaultServer/jpa-folder, not under defaultServer/lib/global and I removed all the version-suffixes from the file-names.
Additionally, make sure to add <feature>bells-1.0</feature>.
Try it
As this post is already getting to long, I will not got into detail here how to use this from your Java EE application. This will be for another post.
But you can already get a working Java EE project to get your hands dirty from my GitHub repository.
Start the Docker Compose environment and use the contained test.sh to invoke some cURL requests against the application on two different cluster-nodes.
Conclusion
With the either of the aboved approaches I was able to enable EclipseLink’s cache-coordination feature on Websphere Liberty for Java EE 7.
I did not try it, but I would assume that it will work similar for Java EE 8 on the latest OpenLiberty builds.
For sure it is nice that plugging in your own JPA-provider is so easy in Liberty; but I don’t like that I have to do this to get a feature of EclipseLink working under Liberty which I would expect to work out of the box. EclipseLink’s cache-coordination feature is a quiet useful extension and it leaves me uncomfortable that I have configured my own snowflake Liberty instead of relying on the standard package. On the other hand, it works; and if I make sure to use the exact same version of EclipseLink as packaged with Liberty out of the box, I would hope the differences are minimal.
The approach I chose/prefer in the end is Liberty Server Configuration with Global Library instead of using the approach that is also in the offical documentation (Liberty Configuration without Global Library).
The reason is that for Liberty Configuration without Global Library I have to reference the library in the server.xml indvidually for each application.
This will not work for applications I would like throw into the dropins.
Deploying a Java EE 7 Application with Kubernetes to the Google Cloud
30 May 2018
In this post I am describing how to deploy a dockerized Java EE 7 application to the Google Cloud Platform (GCP) with Kubernetes.
My previous experience is only with AWS; in specific with EC2 and ECS. So, this is not only my first exposure to the Google Cloud but also my first steps with Kubernetes.
The Application
The application I would like to deploy is a simple Java EE 7 application exposing a basic HTTP/Rest endpoint. The sources are located on GitHub and the Docker image can be found on Docker Hub. If you have Docker installed, you can easily run it locally via
docker run --rm --name hello -p 80:8080 38leinad/hello
Now, in your browser or via cURL, go to http://localhost/hello/resources/health. You should get UP as the response. A simple health-check endpoint. See here for the sources.
Let’s deploy it on the Google Cloud now.
Installation and Setup
Obviously, you will have to register on https://cloud.google.com/ for a free trial-account first. It is valid for one year and also comes with a credit of $300. I am not sure yet what/when resources will cost credit. After four days of tinkering, $1 is gone.
Once you have singed up, you can do all of the configuration and management of your apps from the Google Cloud web-console. They even have an integrated terminal running in the browser. So, strictly it is not required to install any tooling on your local system if you are happy with this.
The only thing we will do from the web-console is the creation of a Kubernetes Cluster (You can also do this via gcloud from the commandline).
For this you go to "Kubernetes Engine / Kubernetes clusters" and "Create Cluster".
You can leave all the defaults, just make sure to remember the name of the cluster and the zone it is deployed to.
We will need this later to correctly set up the kubectl commandline locally.
Note that it will also ask you to set up a project before creating the cluster. This allows grouping of resources in GCP based on different projects which is quiet useful.
Setting up the cluster is heavy lifting and thus can take some minutes. In the meantime, we can already install the tools.
-
Install SDK / CLI (Centos): https://cloud.google.com/sdk/docs/quickstart-redhat-centos.
I had to make sure to be logged out of my Google-account before running
gcloud init. Without doing this, I received a 500 http-response.Also, when running
gcloud initit will ask your for a default zone. Choose the one you used when setting up the cluster. Mine iseurope-west1-b. -
Install the
kubectlcommand:gcloud components install kubectl
Note that you can also install
kubectlindependently. E.g. I already had it installed from here while using minikube. -
Now, you will need the name of the cluster you have created via the web-console. Configure the
gcloudCLI-tool for your cluster:gcloud container clusters get-credentials <cluster-name> --zone <zone-name> --project <project-name>
You can easily get the full command with correct parameters when opening the cluster in the web-console and clicking the "Connect" button for the web-based CLI.
Run kubectl get pods just to see if the command works. You should see No resources found..
At this point, we have configured our CLI/kubectl to interact with our kubernetes cluster.
Namespaces
The next thing we will do is optional but makes life easier once you have multiple applications deployed on your cluster. You can create a namespace/context per application your are deploying to GCP. This allows you to always only see the resources of the namespace you are currently working with. It also allows you to delete the namespace and it will do a cascading delete of all the resources. So, this is very nice for experimentation and not leaving a big mess of resources.
kubectl create namespace hello-namespace
kubectl get namespaces
We create a namespace for our application and check if it actually was created.
You can now attach this namespace to a context. A context is not a resource on GCP but is a configuration in your local <user-home>/.kube/config.
kubectl config set-context hello-context --namespace=hello-namespace \
  --cluster=<cluster-name> \
  --user=<user-name>
What is <cluster-name> and <user-name> that you have to put in? Easiest, is to get it from running
kubectl config view
Let’s activate this context. All operations will be done within the assigned namespace from now on.
kubectl config use-context hello-context
You can also double-check the activated context:
kubectl config current-context
Run the kubectl config view command again or even check in <user-home>/.kube/config. As said before, the current-context can be found here and is just a local setting.
You can read more on namespaces here.
Deploying the Application
Deploying the application in Kubernetes requires three primitives to be created:
-
Deployment/Pods: These are the actually docker-containers that are running. A pod actually could consist of multiple containers. Think of e.g. side-car containers in a microservice architecture.
-
Service: The containers/Pods are hidden behind a service. Think of the Service as e.g. a load-balancer: You never interact with the individual containers directly; the load-balancer is the single service you as a client call.
-
Ingress: Our final goal is to access our application from the Internet. By default, this is not possible. You will have to set up an Ingress for Incoming Traffic. Basically, you will get an internet-facing IP-address that you can call.
All these steps are quiet nicely explained when you read the offical doc on Setting up HTTP Load Balancing with Ingress.
What you will find there, is that Deployment, Service and Ingress are set up via indivdual calls to kubectl. You could put all these calls into a shell-script to easily replay them, but there is something else in the Kubernets world.
What we will be doing here instead, is define these resources in a YAML file.
apiVersion: apps/v1beta2
kind: Deployment
metadata:
  name: hello-deployment
spec:
  selector:
    matchLabels:
      app: hello
  replicas: 1
  template:
    metadata:
      labels:
        app: hello
    spec:
      containers:
      - name: hello
        image: 38leinad/hello:latest
        ports:
        - containerPort: 8080
---
apiVersion: v1
kind: Service
metadata:
  name: hello-service
spec:
  type: NodePort
  selector:
    app: hello
  ports:
    - port: 8080
---
apiVersion: extensions/v1beta1
kind: Ingress
metadata:
  name: hello-ingress
spec:
  backend:
    serviceName: hello-service
    servicePort: 8080
We can now simply call kubectl apply -f hello.yml.
Get the public IP by running
kubectl get ingress hello-ingress
You can now try to open http://<ip>/hello/resources/health in your browser or with cURL. You should get an "UP" response. Note that this can actually take some minutes before it will work.
Once it worked, you can check the application-server log as well like this:
kubectl get pods
kubectl logs -f <pod-name>
Note that the first command is to get the name of the Pod. The second command will give you the log-output of the container; you might know this from plain Docker already.
We succesfully deployed a dockerized application to the Google Cloud via Kubernetes.
A final not on why namespaces are useful: What you can do now to start over again is invoke
kubectl delete namespace hello-namespace
and all the resources in the cluster are gone.
Lastly, a cheat-sheet for some of the important kubectl commands can be found here.
Here, you will also find how to get auto-completion in your shell which is super-useful. As I am using zsh, I created an alias for it:
alias kubeinit="source <(kubectl completion zsh)"
Websphere Liberty EclipseLink Logging
14 May 2018
Websphere Liberty uses EclipseLink as the default JPA-implementation. How to log the SQL-commands from EclipseLink in the Websphere Liberty stdout/console?
First step is enabling the logging in the persistence.xml:
<properties>
    <property name="eclipselink.logging.level.sql" value="FINE" />
    <property name="eclipselink.logging.level" value="FINE" />
    <property name="eclipselink.logging.level.cache" value="FINE" />
</properties>
This is not sufficient to get any output on stdout.
Additionally, the following snippet needs to be added to the server.xml:
<logging traceSpecification="*=info:eclipselink.sql=all" traceFileName="stdout" traceFormat="BASIC"/>Set traceFileName="trace.log" to get the statements printed to the trace.log instead.
Gradle and Docker Compose for System Testing
06 May 2018
Recently, I read this article on a nice Gradle-plugin that allows to use Docker Compose from Gradle. I wanted to try it out myself with a simple JavaEE app deployed on Open Liberty. In specific, the setup is as follows: The JavaEE application (exposing a Rest endpoint) is deployed on OpenLiberty running within Docker. The system-tests are invocing the Rest endpoint from outside the Docker environment via HTTP.
I had two requirements that I wanted to verify in specific:
-
Usually, when the containers are started from docker-perspecive, it does not mean that also the deployed application is fully up and running. Either you have to write some custom code that monitors the application-log for some marker; or, we can leverage the Docker health-check. Does the Docker Compose Gradle-plugin provide any integration for this so we only run the system-tests once the application is up?
-
System-test will be running on the Jenkins server. Ideally, a lot of tests are running in parallel. For this, it is necessary to use dynamic ports. Otherwise, there could be conflicts for the exposed HTTP ports of the different system-tests. Each system-test somehow needs to be aware of its dynamic ports. Does the Gradle-plugin help us with this?
Indeed, the Gradle-plugin helps us with these two requirements.
Rest Service under Test
The Rest endpoint under test looks like this:
@Stateless
@Path("ping")
public class PingResource {

	static AtomicInteger counter = new AtomicInteger();

	@GET
	public Response ping() {
		if (counter.incrementAndGet() > 10) {
			System.out.println("++ UP");
			return Response.ok("UP@" + System.currentTimeMillis()).build();
		}
		else {
			System.out.println("++ DOWN");
			return Response.serverError().build();
		}

	}
}
I added some simple logic here to only return HTTP status code 200 after some number of request. This is to verify the health-check mechanism works as expected.
System Test
The system-tests is a simple JUnit test using the JAX-RS client to invoke the ping endpoint.
public class PingST {

    @Test
    public void testMe() {
        Response response = ClientBuilder.newClient()
            .target("http://localhost:"+ System.getenv("PING_TCP_9080") +"/ping")
            .path("resources/ping")
            .request()
            .get();

        assertThat(response.getStatus(), CoreMatchers.is(200));
        assertThat(response.readEntity(String.class), CoreMatchers.startsWith("UP"));
    }
}
You can already see here, that we read the port from an environment variable. Also, the test should only succeed when we get the response UP.
Docker Compose
The docker-compose.yml looks as follows:
version: '3.4'
services:
  ping:
    image: openliberty/open-liberty:javaee7
    ports:
     - "9080"
    volumes:
     - "./build/libs/:/config/dropins/"
    healthcheck:
      test: wget --quiet --tries=1 --spider http://localhost:9080/ping/resources/ping || exit 1
      interval: 5s
      timeout: 10s
      retries: 3
      start_period: 30s
We are using the health-check feature here. If you run docker ps the column STATUS will tell you the health of the container based on executing this command.
The ping service should only show up as healthy after ~ 30 + 10 * 5 seconds. This is because it will only start the health-checks after 30 seconds. And then the first 10 requests will return response-code 500. After this, it will flip to status-code 200 and return UP.
If the Gradle-plugin makes sure to only run the tests once the health of the container is Ok, the PingST should pass successfully.
Gradle Build
The latest part is the build.gradle that brings it all together:
plugins {
    id 'com.avast.gradle.docker-compose' version '0.7.1'(1)
}

apply plugin: 'war'
apply plugin: 'maven'
apply plugin: 'eclipse-wtp'

group = 'de.dplatz'
version = '1.0-SNAPSHOT'

sourceCompatibility = 1.8
targetCompatibility = 1.8

repositories {
    jcenter()
}

dependencies {
    providedCompile 'javax:javaee-api:7.0'

    testCompile 'org.glassfish.jersey.core:jersey-client:2.25.1'
    testCompile 'junit:junit:4.12'
}

war {
	archiveName 'ping.war'
}

dockerCompose {(2)
    useComposeFiles = ['docker-compose.yml']
    isRequiredBy(project.tasks.systemTest)
}

task systemTest( type: Test ) {(3)
    include '**/*ST*'
    doFirst {
        dockerCompose.exposeAsEnvironment(systemTest)
    }
}

test {
    exclude '**/*ST*'(4)
}-
The Docker Compose gradle-plugin
-
A seperate task to run system-tests
-
The task to start the Docker environment based on the
docker-compose.yml -
Don’t run system-tests as part of the regular unit-test task
The tasks composeUp and composeDown can be used to manually start/stop the environment, but the system-test task (systemTest) has a dependency on the Docker environment via isRequiredBy(project.tasks.itest).
We also use dockerCompose.exposeAsEnvironment(itest) to expose the dynamic ports as environment variables to PingST. In the PingST class you can see that PING_TCP_9080 is the environment variable name that contains the exposed port on the host for the container-port 9080.
Please note that the way I chose to seperate unit-tests and system-tests here in the build.gradle is very pragmatic but might not be ideal for bigger projects. Both tests share the same classpath. You might want to have a seperate Gradle-project for the system-tests altogether.
Wrapping it up
We can now run gradle systemTest to run our system-tests.
It will first start the Docker environment and monitor the health of the containers.
Only when the contain is healthy (i.e. the application is fully up and running), will gradle continue and execute PingST.
Also, ports are dynamically assigned and the PingST reads them from the environment. With this approach, we can safely run the tests on Jenkins where other tests might already be using ports like 9080.
The com.avast.gradle.docker-compose plugin allows us to easily integrate system-tests for JavaEE applications (using Docker) into our Gradle build.
Doing it this way, allows every developer that has Docker installed, to run these tests locally as well and not only on Jenkins.
MicroProfile Metrics
11 April 2018
These are my personal notes on getting familiar with MicroProfile 1.3. In specific Metrics 1.1.
As a basis, I have been using the tutorial on OpenLiberty.io.
Not suprising, I am using OpenLiberty (version 18.0.0.1). The server.xml which serves as the starting-point is described here.
I am just listing the used features here:
server.xml
<featureManager>
    <feature>javaee-7.0</feature>
    <feature>localConnector-1.0</feature>
    <feature>microProfile-1.3</feature>
</featureManager>
Some differences:
-
javaee-7.0is used, as Java EE 8 seems not to be supported yet by the release builds. -
microProfile-1.3to enable all features as part of MicroProfile 1.3
As a starting-point for the actual project I am using my Java EE WAR template.
To get all MicroProfile 1.3 dependencies available in your gradle-build, you can add the following provided-dependency:
providedCompile 'org.eclipse.microprofile:microprofile:1.3'
Now lets write a simple Rest-service to produce some metrics.
@Stateless
@Path("magic")
public class MagicNumbersResource {

	static int magicNumber = 0;

	@POST
	@Consumes("text/plain")
	@Counted(name = "helloCount", absolute = true, monotonic = true, description = "Number of times the hello() method is requested")
	@Timed(name = "helloRequestTime", absolute = true, description = "Time needed to get the hello-message")
	public void setMagicNumber(Integer num) throws InterruptedException {
		TimeUnit.SECONDS.sleep(2);
		magicNumber = num;
	}

	@Gauge(unit = MetricUnits.NONE, name = "magicNumberGuage", absolute = true, description = "Magic number")
	public int getMagicNumber() {
		return magicNumber;
	}
}
I am using:
-
A
@Timedmetric that records the percentiles and averages for the duration of the method-invocation -
A
@Countedmetric that counts the number of invocations -
A
@Gaugemetric that just takes the return-value of the annotated method as the metric-value.
Now deploy and invoke curl -X POST -H "Content-Type: text/plain" -d "42" http://localhost:9080/mptest/resources/magic. (This assumes the application/WAR is named mptest).
Now open http://localhost:9080/metrics in the browser. You should see the following prometheus-formatted metrics:
# TYPE application:hello_request_time_rate_per_second gauge
application:hello_request_time_rate_per_second 0.1672874737158507
# TYPE application:hello_request_time_one_min_rate_per_second gauge
application:hello_request_time_one_min_rate_per_second 0.2
# TYPE application:hello_request_time_five_min_rate_per_second gauge
application:hello_request_time_five_min_rate_per_second 0.2
# TYPE application:hello_request_time_fifteen_min_rate_per_second gauge
application:hello_request_time_fifteen_min_rate_per_second 0.2
# TYPE application:hello_request_time_mean_seconds gauge
application:hello_request_time_mean_seconds 2.005084111
# TYPE application:hello_request_time_max_seconds gauge
application:hello_request_time_max_seconds 2.005084111
# TYPE application:hello_request_time_min_seconds gauge
application:hello_request_time_min_seconds 2.005084111
# TYPE application:hello_request_time_stddev_seconds gauge
application:hello_request_time_stddev_seconds 0.0
# TYPE application:hello_request_time_seconds summary
# HELP application:hello_request_time_seconds Time needed to get the hello-message
application:hello_request_time_seconds_count 1
application:hello_request_time_seconds{quantile="0.5"} 2.005084111
application:hello_request_time_seconds{quantile="0.75"} 2.005084111
application:hello_request_time_seconds{quantile="0.95"} 2.005084111
application:hello_request_time_seconds{quantile="0.98"} 2.005084111
application:hello_request_time_seconds{quantile="0.99"} 2.005084111
application:hello_request_time_seconds{quantile="0.999"} 2.005084111 (1)
# TYPE application:magic_number_guage gauge
# HELP application:magic_number_guage Magic number
application:magic_number_guage 42 (3)
# TYPE application:hello_count counter
# HELP application:hello_count Number of times the hello() method is requested
application:hello_count 1 (2)-
This is one of the percentiles from
@Timed. Due to the sleep, it is close to two seconds. -
This metrics is based on
@Counted. We invoked the method once via curl. -
This metric is based on the
@Gauge. We did a post with curl to set themagicNumberto 42. So, this is what the gauge will get fromgetMagicNumber().
As a final note: I like the Java EE-approach of having a single dependency to develop against (javax:javaee-api:7.0).
I have used the same approach here for the Microprofile.
If you instead only want to enable the metrics-feature in Liberty and only want to program against the related API, you can instead have used the following feature in the server.xml:
<feature>mpMetrics-1.1</feature>
And the following dependency in your build.gradle:
providedCompile 'org.eclipse.microprofile.metrics:microprofile-metrics-api:1.1'
I find this approach more cumbersome if multiple MicroProfile APIs are used; and the neglectable difference in startup-time of Liberty confirms that there is no disadvantage.
In a later post we will look at what can be done with the metrics.
Websphere Traditional, Docker and Auto-Deployment
10 April 2018
The software I work with on my job is portable accross different application-servers; including Websphere Trational, Websphere Liberty and JBoss. In the past, it took cosiderable time for me to test/make sure a feature works as expected on Websphere. In part, because it was hard for me to keep all different websphere version installed on my machine and not mess them up over time.
Now, with the docker images provided by IBM, it has become very easy. Just fire up a container and test it.
To make the testing/deployment very easy, I have enabled auto-deploy in my container-image.
The image contains a jython script so you don’t have to apply this configuration manually.
import java.lang.System as sys

cell = AdminConfig.getid('/Cell:DefaultCell01/')
md = AdminConfig.showAttribute(cell, "monitoredDirectoryDeployment")
AdminConfig.modify(md, [['enabled', "true"]])
AdminConfig.modify(md, [['pollingInterval', "1"]])

print AdminConfig.show(md)

AdminConfig.save()

print 'Done.'
It allows me to work with VSCode and Gradle as I have described in this post.
Start the docker container with below command to mount the auto-deploy folder as a volume:
docker run --name was9 --rm -p 9060:9060 -p 9080:9080 -p 7777:7777 -v ~/junk/deploy:/opt/IBM/WebSphere/AppServer/profiles/AppSrv01/monitoredDeployableApps 38leinad/was-9
You can now copy a WAR file to ~/junk/deploy/servers/server1/ on your local system and it will get deployed automatically within the container.
|
Note
|
After this post, I have extended the was-9 container so can directly mount /opt/IBM/WebSphere/AppServer/profiles/AppSrv01/monitoredDeployableApps/servers/server1/.
It even supports deployment of a WAR/EAR that is already in this folder when the container is started. This is not the default behaviour of Websphere.
Basically, the container will do a touch on any WAR/EAR in this folder once the auto-deploy service is watching the folder.
|
Gradle and Arquillian Chameleon even simpler
07 April 2018
In a previous post I have already described how to use Arquillian Chameleon to simplify the Arquillian config.
With the latest improvements that are described here in more detail, it is now possible to minimize the required configuration:
-
Only a single dependency
-
No
arquillian.xml
As before, I assume Gradle 4.6 with enableFeaturePreview('IMPROVED_POM_SUPPORT') in the settings.gradle.
With this, we only have to add a single dependency to use arquillian:
dependencies {
    providedCompile 'javax:javaee-api:7.0'

    testCompile 'org.arquillian.container:arquillian-chameleon-junit-container-starter:1.0.0.CR2'

    testCompile 'junit:junit:4.12'
    testCompile 'org.mockito:mockito-core:2.10.0'
}
The used container only needs to be defined via the @ChameleonTarget annotation.
Also note the new @RunWith(ArquillianChameleon.class). This not the regular @RunWith(ArquillianChameleon.class).
@RunWith(ArquillianChameleon.class)
@ChameleonTarget("wildfly:11.0.0.Final:managed")
public class GreetingServiceTest {

    @Deployment
    public static WebArchive deployService() {
        return ShrinkWrap.create(WebArchive.class)
                .addClass(Service.class);
    }

    @Inject
    private Service service;

    @Test
    public void shouldGreetTheWorld() throws Exception {
        Assert.assertEquals("hello world", service.hello());
    }
}
There is also support now for not having to write the @Deployment method. Up to now, only for maven-build and specifing a local file.
Open Liberty with DerbyDB
13 March 2018
In this post I describe how to use Open Liberty with the lightweight Apache Derby database.
Here are the steps:
-
Download Apache Derby.
-
Configure the driver/datasource in the
server.xml<!-- https://www.ibm.com/support/knowledgecenter/de/SS7K4U_liberty/com.ibm.websphere.wlp.zseries.doc/ae/twlp_dep_configuring_ds.html --> <variable name="DERBY_JDBC_DRIVER_PATH" value="/home/daniel/dev/tools/db-derby-10.14.1.0-bin/lib"/> <library id="DerbyLib"> <fileset dir="${DERBY_JDBC_DRIVER_PATH}"/> </library> <dataSource id="DefaultDerbyDatasource" jndiName="jdbc/defaultDatasource" statementCacheSize="10" transactional="true"> <jdbcDriver libraryRef="DerbyLib"/> <properties.derby.embedded connectionAttributes="upgrade=true" createDatabase="create" databaseName="/var/tmp/sample.embedded.db" shutdownDatabase="false"/> <!--properties.derby.client databaseName="/var/tmp/sample.db" user="derbyuser" password="derbyuser" createDatabase="create" serverName="localhost" portNumber="1527" traceLevel="1"/--> </dataSource>Note that the database is embeeded and file-based. This means, no database-server needs to be started manually. On application-server startup an embeeded database is started and will write to the file under
databaseName. Use thememory:prefix, to just hold it in main-memory and not on the filesystem.As an alternative, you can also start the Derby-network-server seperately and connect by using the
properties.derby.clientinstead. -
In case you want to use the datasource with JPA, provide a
persistence.xml:<?xml version="1.0" encoding="UTF-8"?> <persistence version="2.1" xmlns="http://xmlns.jcp.org/xml/ns/persistence" xmlns:xsi="http://www.w3.org/2001/XMLSchema-instance" xsi:schemaLocation="http://xmlns.jcp.org/xml/ns/persistence http://xmlns.jcp.org/xml/ns/persistence/persistence_2_1.xsd"> <persistence-unit name="prod" transaction-type="JTA"> <jta-data-source>jdbc/defaultDatasource</jta-data-source> <properties> <property name="hibernate.show_sql" value="true" /> <property name="eclipselink.logging.level" value="FINE" /> <property name="javax.persistence.schema-generation.database.action" value="drop-and-create" /> <property name="javax.persistence.schema-generation.scripts.action" value="drop-and-create" /> <property name="javax.persistence.schema-generation.scripts.create-target" value="bootstrapCreate.ddl" /> <property name="javax.persistence.schema-generation.scripts.drop-target" value="bootstrapDrop.ddl" /> </properties> </persistence-unit> </persistence>With the default settings of Gradle’s war-plugin, you can place it under
src/main/resources/META-INFand the build should package it underWEB-INF/classes/META-INF. -
You should now be able to inject the entity-manager via
@PersistenceContext
EntityManager em;
This blog has a similar guide on how to use PostgreSQL with Open Liberty.
Gradle and Arquillian for OpenLiberty
12 March 2018
In this post I describe how to use arquillian together with the container-adapter for Websphere-/Open-Liberty.
The dependencies are straight-forward as for any other container-adapter except the additional need for the tools.jar on the classpath:
dependencies {
    providedCompile 'javax:javaee-api:7.0'

    // this is the BOM
    testCompile 'org.jboss.arquillian:arquillian-bom:1.3.0.Final'
    testCompile 'org.jboss.arquillian.junit:arquillian-junit-container'

    testCompile files("${System.properties['java.home']}/../lib/tools.jar")
    testCompile 'org.jboss.arquillian.container:arquillian-wlp-managed-8.5:1.0.0.CR1'

    testCompile 'junit:junit:4.12'
    testCompile 'org.mockito:mockito-core:2.10.0'
}
A minimalistic arquillian.xml looks like the following:
<?xml version="1.0" encoding="UTF-8"?>
<arquillian xmlns:xsi="http://www.w3.org/2001/XMLSchema-instance"
    xmlns="http://jboss.org/schema/arquillian"
    xsi:schemaLocation="http://jboss.org/schema/arquillian http://jboss.org/schema/arquillian/arquillian_1_0.xsd">

    <engine>
        <property name="deploymentExportPath">build/deployments</property>
    </engine>

    <container qualifier="wlp-dropins-deployment" default="true">
        <configuration>
            <property name="wlpHome">${wlp.home}</property>
            <property name="deployType">dropins</property>
            <property name="serverName">server1</property>
        </configuration>
    </container>

</arquillian>
As there is no good documentation, on the supported properties, I had to look into the sources over on Github.
Also, you might not want to hard-code the wlp.home here. Instead you can define it in your build.gradle like this:
test {
    systemProperty "arquillian.launch", "wlp-dropins-deployment"
    systemProperty "wlp.home", project.properties['wlp.home']
}
This will allow you to run gradle -Pwlp.home=<path-to-wlp> test.
Gradle and Arquillian for Wildfly
28 February 2018
In this post I describe how to set up arquillian to test/deploy on Wildfly. Note that there is a managed and a remote-adapter. Managed will mean that arquillian manages the application-server and thus starts it. Remote means that the application-server was already started somehow and arquillian will only connect and deploy the application within this remote server. Below you will find the dependencies for both types of adpaters.
dependencies {
    providedCompile 'javax:javaee-api:7.0'

    // this is the BOM
    testCompile 'org.jboss.arquillian:arquillian-bom:1.3.0.Final'
    testCompile 'org.jboss.arquillian.junit:arquillian-junit-container'

    testCompile 'org.wildfly.arquillian:wildfly-arquillian-container-managed:2.1.0.Final'
    testCompile 'org.wildfly.arquillian:wildfly-arquillian-container-remote:2.1.0.Final'

    testCompile 'junit:junit:4.12'
    testCompile 'org.mockito:mockito-core:2.10.0'
}|
Note
|
Note that the BOM-import will only work with Gradle 4.6+ |
An arquillian.xml for both adapters looks like the following. The arquillian-wildfly-managed config is enabled here by default.
<?xml version="1.0" encoding="UTF-8"?>
<arquillian xmlns:xsi="http://www.w3.org/2001/XMLSchema-instance"
    xmlns="http://jboss.org/schema/arquillian"
    xsi:schemaLocation="http://jboss.org/schema/arquillian http://jboss.org/schema/arquillian/arquillian_1_0.xsd">

    <engine>
        <property name="deploymentExportPath">build/deployments</property>
    </engine>

    <!-- Start JBoss manually via:
        ./standalone.sh -Djboss.socket.binding.port-offset=100 -server-config=standalone-full.xml
     -->
    <container qualifier="arquillian-wildfly-remote">
        <configuration>
            <property name="managementPort">10090</property>
        </configuration>
    </container>

    <container qualifier="arquillian-wildfly-managed" default="true">
        <configuration>
            <property name="jbossHome">/home/daniel/dev/app-servers/jboss-eap-7.0-test</property>
            <property name="serverConfig">${jboss.server.config.file.name:standalone-full.xml}</property>
            <property name="allowConnectingToRunningServer">true</property>
        </configuration>
    </container>
</arquillian>
As an additional tip: I always set deploymentExportPath to a folder withing gradle’s build-directory because sometimes it is helpful to have a look at the deployment generated by arquillian/shrinkwrap.
In case you don’t want to define a default adapater or overwrite it (e.g. via a gradle-property from the commandline), you can define the arquillian.launch system property within the test-configuration.
test {
    systemProperty "arquillian.launch", "arquillian-wildfly-managed"
}
Gradle and Arquillian Chameleon
26 February 2018
The lastest Gradle 4.6 release candiates come with BOM-import support.
It can be enabled in the settings.gradle by defining enableFeaturePreview('IMPROVED_POM_SUPPORT').
With this, the Arquillian BOM can be easily imported and the dependecies to use Arquillian with the Chameleon Adapter look like the following:
dependencies {
    providedCompile 'javax:javaee-api:7.0'

    // this is the BOM
    testCompile 'org.jboss.arquillian:arquillian-bom:1.3.0.Final'
    testCompile 'org.jboss.arquillian.junit:arquillian-junit-container'
    testCompile 'org.arquillian.container:arquillian-container-chameleon:1.0.0.Beta3'

    testCompile 'junit:junit:4.12'
    testCompile 'org.mockito:mockito-core:2.10.0'
}
Chameleon allows to easily manage the container adapters by simple configuration in the arquillian.xml.
As of today, Wildfly and Glassfish are supported but not Websphere liberty.
To define Wildfly 11, the following arquillian.xml (place under src/test/resources) is sufficient:
<?xml version="1.0" encoding="UTF-8"?>
<arquillian xmlns:xsi="http://www.w3.org/2001/XMLSchema-instance"
    xmlns="http://jboss.org/schema/arquillian"
    xsi:schemaLocation="http://jboss.org/schema/arquillian http://jboss.org/schema/arquillian/arquillian_1_0.xsd">

    <container qualifier="wildfly" default="true">
        <configuration>
            <property name="chameleonTarget">wildfly:11.0.0.Final:managed</property>
        </configuration>
    </container>
</arquillian>
With this little bit of Gradle and Arquillian magic, you should be able to run a test like below. The Wildfly 11 container will be downloaded on the fly.
@RunWith(Arquillian.class)
public class GreetingServiceTest {

    @Deployment
    public static WebArchive deployService() {
        return ShrinkWrap.create(WebArchive.class)
                .addClass(Service.class);
    }

    @Inject
    private Service service;

    @Test
    public void shouldGreetTheWorld() throws Exception {
        Assert.assertEquals("hello world", service.hello());
    }
}
Gradle: Automatic and IDE-independent redeployments on OpenLiberty
25 February 2018
The last weeks I have started to experiment how well VSCode can be used for Java EE development. I have to say that it is quiet exciting to watch what the guys at Microsoft and Red Hat are doing with the Java integration. The gist of it: It cannot replace a real Java IDE yet for a majority of heavy development, but i can see the potential due to its lightweightness in projects that also involve a JavaScript frontend. The experience of developing Java and JavaScript in this editor is quiet nice compared to a beast like Eclipse.
One of my first goals for quick development: Reproduce the automatical redeploy you get from IDEs like Eclipse (via JBoss Tools). I.e. changing a Java-class automatically triggers a redeploy of the application. As long as you make sure the WAR-file is small, this deploy task takes less then a second and allows for quick iterations.
Here the steps how to make this work in VS Code; actually, they are independent of VSCode and just leverage Gradle’s continous-build feature.
Place this task in your build.gradle. It deploys your application to the dropins-folder of OpenLiberty if you have set up the environment variable wlpProfileHome.
task deployToWlp(type: Copy, dependsOn: 'war') {
    dependsOn 'build'
    from war.archivePath
    into "${System.env.wlpProfileHome}/dropins"
}
Additionally, make sure to enable automatic redeploys in your server.xml whenever the contents of the dropins-folder change.
<!-- hot-deploy for dropins -->
<applicationMonitor updateTrigger="polled" pollingRate="500ms" dropins="dropins" dropinsEnabled="true"/>
Every time you run gradlew deployToWlp, this should trigger a redeploy of the latest code.
Now comes the next step: Run gradlew deployToWlp -t for continuous builds.
Every code-change should trigger a redeploy. This is indepdent of any IDE and thus works nicely together with VS Code in case you want this level of interactivity.
If not, it is very easy to just map a shortcut to the gradle-command in VSCode to trigger it manually.
Arquillian UI Testing from Gradle
24 February 2018
Lets for this post assume we want to test some Web UI that is already running somehow. I.e. we don’t want to start up the container with the web-app from arquillian.
Arquillian heavily relies on BOMs to get the right dependencies. Gradle out of the box is not able to handle BOMs; but we can use the nebula-plugin. Import-scoped POMs are not supported at all.
So, make sure you have the following in your build.gradle:
plugins {
    id 'nebula.dependency-recommender' version '4.1.2'
}

apply plugin: 'java'

sourceCompatibility = 1.8
targetCompatibility = 1.8

repositories {
    jcenter()
}

dependencyRecommendations {
    mavenBom module: 'org.jboss.arquillian:arquillian-bom:1.2.0.Final'
}

dependencies {
    testCompile 'junit:junit:4.12'

    testCompile "org.jboss.arquillian.junit:arquillian-junit-container"
    testCompile "org.jboss.arquillian.graphene:graphene-webdriver:2.0.3.Final"
}
Now the test:
@RunAsClient
@RunWith(Arquillian.class)
public class HackerNewsIT {

    @Drone
    WebDriver browser;

    @Test
    public void name() {
        browser.get("https://news.ycombinator.com/");
        String title = browser.getTitle();
        Assert.assertThat(title, CoreMatchers.is("Hacker News"));
    }

}
Run with it with gradle test.
By default, HTMLUnit will be used as the browser. To use Chrome, download the https://sites.google.com/a/chromium.org/chromedriver/WebDriver.
If you dont want to put it on your PATH, tie it to the WebDriver like this in your arquillian.xml:
 <arquillian xmlns="http://jboss.com/arquillian" xmlns:xsi="http://www.w3.org/2001/XMLSchema-instance"
    xsi:schemaLocation="http://jboss.org/schema/arquillian http://jboss.org/schema/arquillian/arquillian_1_0.xsd">

    <extension qualifier="webdriver">
        <property name="browser">chrome</property>
        <property name="chromeDriverBinary">/home/daniel/dev/tools/chromedriver</property>
    </extension>

</arquillian>
Checkstyle with Gradle
30 January 2018
Get a checkstyle.xml and; e.g. from SUN and place in your gradle-project under config/checkstyle/checkstyle.xml.
Now add the following to your build.gradle:
apply plugin: 'checkstyle'

checkstyle {
    showViolations = true
    ignoreFailures = false
}
Run with it with gradle check.
If there are violations, a HTML-report will be written to build/reports/checkstyle.
OpenLiberty Java EE 8 Config
22 January 2018
I am working of the latest Development Builds of Open Liberty supporting Java EE 8. You can download them here under "Development builds".
When you create a new server in Websphere/Open Liberty via ${WLP_HOME}/bin/server create server1, the generated server.xml is not configured properly for SSL, Java EE, etc.
Here is a minimal server.xml that works:
<?xml version="1.0" encoding="UTF-8"?>
<server description="new server">

    <!-- Enable features -->
    <featureManager>
        <feature>javaee-8.0</feature>
        <feature>localConnector-1.0</feature>
    </featureManager>

    <!-- To access this server from a remote client add a host attribute to the following element, e.g. host="*" -->
    <httpEndpoint httpPort="9080" httpsPort="9443" id="defaultHttpEndpoint"/>

    <keyStore id="defaultKeyStore" password="yourpassword"/>

    <!-- Automatically expand WAR files and EAR files -->
    <applicationManager autoExpand="true"/>

    <quickStartSecurity userName="admin" userPassword="admin12!"/>

    <!-- hot-deploy for dropins -->
    <applicationMonitor updateTrigger="polled" pollingRate="500ms"
                    dropins="dropins" dropinsEnabled="true"/>
</server>
Together with this build.gradle file you can start developing Java EE 8 applications:
apply plugin: 'war'
apply plugin: 'maven'

group = 'de.dplatz'
version = '1.0-SNAPSHOT'

sourceCompatibility = 1.8
targetCompatibility = 1.8

repositories {
    jcenter()
}

dependencies {
    providedCompile 'javax:javaee-api:8.0'
    testCompile 'junit:junit:4.12'
}

war {
    archiveName 'webapp.war'
}

task deployToWlp(type: Copy, dependsOn: 'war') {
    dependsOn 'build'
    from war.archivePath
    into "${System.env.wlpProfileHome}/dropins"
}
OpenLiberty Debug Config
21 January 2018
You can run a Websphere/Open Liberty via ${WLP_HOME}/bin/server debug server1 in debug-mode.
But this makes the server wait for a debugger to attach. How to attach later?
Create a file ${WLP_HOME}/usr/servers/server1/jvm.options and add the debug-configuration:
-agentlib:jdwp=transport=dt_socket,server=y,suspend=n,address=7777
Now you can use ${WLP_HOME}/bin/server run server1.
Gradle deploy-task
20 January 2018
Deploy to e.g. Websphere liberty by adding this task to your build.gradle file:
task deployToWlp(type: Copy, dependsOn: 'war') {
    dependsOn 'build'
    from war.archivePath
    into "${System.env.wlpProfileHome}/dropins"
}
Assuming you have the environment-variable set, you can now run gradlew deployToWlp.
Implementing JAX-RS-security via Basic-auth
31 October 2017
Basic-auth is the simplest and weakest protection you can add to your resources in a Java EE application. This post shows how to leverage it for JAX-RS-resources that are accessed by a plain HTML5/JavaScript app.
Additionally, I had the following requirements:
-
The JAX-RS-resource is requested from a prue JavaScript-based webapp via the fetch-API; I want to leverage the authentication-dialog from the browser within the webapp (no custom dialog as the webapp should stay as simple as possible and use as much as possible the standard offered by the browser).
-
But I don’t want the whole WAR (i.e. JavaScript app) to be protected. Just the request to the JAX-RS-endpoint should be protected via Basic-auth
-
At the server-side I want to be able to connect to my own/custom identity-store; i.e. I want to programatically check the username/password myself. In other words: I don’t want the application-server’s internal identity-stores/authentication.
Protecting the JAX-RS-endpoint at server-side is as simple as implementing a request-filter. I could have used a low-level servlet-filter, but instead decided to use the JAX-RS-specific equivalent:
import javax.ws.rs.container.ContainerRequestContext;
import javax.ws.rs.container.ContainerRequestFilter;
import javax.ws.rs.core.Response;
import javax.ws.rs.ext.Provider;

@Provider
public class SecurityFilter implements ContainerRequestFilter {

	@Override
	public void filter(ContainerRequestContext requestContext) throws IOException {
		String authHeader = requestContext.getHeaderString("Authorization");
		if (authHeader == null || !authHeader.startsWith("Basic")) {
			requestContext.abortWith(Response.status(401).header("WWW-Authenticate", "Basic").build());
			return;
		}

		String[] tokens = (new String(Base64.getDecoder().decode(authHeader.split(" ")[1]), "UTF-8")).split(":");
		final String username = tokens[0];
		final String password = tokens[1];

		if (username.equals("daniel") && password.equals("123")) {
			// all good
		}
		else {
			requestContext.abortWith(Response.status(401).build());
			return;
		}
	}

}
If the Authorization header is not present, we request the authentication-dialog from the browser by sending the header WWW-Authenticate=Basic.
If i directly open up the JAX-RS-resource in the browser, I get the uthentication-dialog from the browser and can access the resource (if I provide the correct username and password).
Now the question is if this also works when the JAX-RS-resource if fetched via the JavaScript fetch-API. I tried this:
function handleResponse(response) {
	if (response.status == "401") {
		alert("not authorized!")
	} else {
		response.json().then(function(data) {
			console.log(data)
		});
	}
}

fetch("http://localhost:8080/service/resources/health").then(handleResponse);
It did not work; I was getting 401 from the server because the browser was not sending the "Authorization" header; but the browser also did not show the authentication-dialog.
A peak into the spec hinted that it should work:
If request’s use-URL-credentials flag is unset or authentication-fetch flag is set, then run these subsubsteps: …
Let username and password be the result of prompting the end user for a username and password, respectively, in request’s window.
So, i added the credentials to the fetch:
fetch("http://localhost:8080/service/resources/health", {credentials: 'same-origin'}).then(handleResponse);It worked. The browser shows the authentication-dialog after the first 401. In subsequent request to the JAX-RS-resouce, the "Authorization" header is always sent along. No need to reenter every time (Chrome discards it as soon as the browser window is closed).
The only disadvantage I found so far is from a development-perspective.
I usually run the JAX-RS-endpoint seperately from my Javascript app; i.e. the JAX-RS-endpoint is hosted as a WAR in the application-server but the JavaScript-app is hosted via LiveReload or browser-sync.
In this case, the JAX-RS-service and the webapp do not have the same origin (different port) and I have to use the CORS-header Access-Control-Allow-Origin=* to allow communication between the two.
But with this header set, the Authorization-token collected by the JavaScript-app will not be shared with the JAX-RS-endpoint.
Github - Switch to fork
05 October 2017
Say you just have cloned a massive github repository (like Netbeans) where cloning already takes minutes and now decide to contribute. You will fork the repo and than clone the fork and spend another X minutes waiting?
This sometimes seems like to much of an effort. And thankfully, there are steps how you can transform the already cloned repo to use your fork.
-
Fork the repo
-
Rename origin to upstream (your fork will be origin)
git remote rename origin upstream
-
Set origin as your fork
git remote add origin git@github...my-fork
-
Fetch origin
git fetch origin
-
Make master track new origin/master
git checkout -B master --track origin/master
Websphere and JVisualVM
25 September 2017
How to inspect a Websphere server via JVisualVM?
Go to "Application servers > SERVER-NAME > Java and Process management > Process Defintion > Java Virtual Machine > Generic JVM arguments" and add the following JMV settings:
-Djavax.management.builder.initial= \
-Dcom.sun.management.jmxremote \
-Dcom.sun.management.jmxremote.authenticate=false \
-Dcom.sun.management.jmxremote.ssl=false \
-Dcom.sun.management.jmxremote.local.only=false \
-Dcom.sun.management.jmxremote.port=1099 \
-Djava.rmi.server.hostname=10.226.2.64
Providing an external ip or hostname was important for it to work.
Select "Add JMX Connection" in JVisualVM and enter: 10.226.2.64:1099.
Websphere Administration via JMX, JConsole and JVisualVM
25 September 2017
How to connect to the Websphere-specific MBean server to configure the environment and monitor the applications?
Start JConsole with the following script:
#!/bin/bash

# Change me!
export HOST=swpsws16
# This is ORB_LISTENER_ADDRESS
export IIOP_PORT=9811

export WAS_HOME=/home/daniel/IBM/WebSphere/AppServer

export PROVIDER=-Djava.naming.provider.url=corbaname:iiop:$HOST:$IIOP_PORT

export CLASSPATH=
export CLASSPATH=$CLASSPATH:$WAS_HOME/java/lib/tools.jar
export CLASSPATH=$CLASSPATH:$WAS_HOME/runtimes/com.ibm.ws.admin.client_8.5.0.jar
export CLASSPATH=$CLASSPATH:$WAS_HOME/runtimes/com.ibm.ws.ejb.thinclient_8.5.0.jar
export CLASSPATH=$CLASSPATH:$WAS_HOME/runtimes/com.ibm.ws.orb_8.5.0.jar
export CLASSPATH=$CLASSPATH:$WAS_HOME/java/lib/jconsole.jar

export URL=service:jmx:iiop://$HOST:$IIOP_PORT/jndi/JMXConnector

$WAS_HOME/java/bin/java -classpath $CLASSPATH $PROVIDER sun.tools.jconsole.JConsole $URL
Even nicer: Install VisualWAS plugin for JVisualVM.
-
Use "Add JMX Connection"
-
Use Connection-Type "Websphere"
-
For port, use SOAP_CONNECTOR_ADDRESS (default 8880)
Jenkins in Docker using Docker
23 September 2017
Say you want to run your Jenkins itself in docker. But the Jenkins build-jobs also uses docker!?
Either you have to install docker in docker, or you let the Jenkins docker-client access the host’s docker-daemon.
-
Map the unix socket into the Jenkins container:
-v /var/run/docker.sock:/var/run/docker.sock
-
But the jenkins user will not have permissions to access the socket by default. So, first check the GID of the group that owns the socket:
getent group dockerroot
-
Now create a group (name is irrelevant; lets name it "docker") in the Jenkins container with the same GID and assign the jenkins user to it:
sudo groupadd -g 982 docker
sudo usermod -aG docker jenkins
ES6 with Nashorn in JDK9
14 June 2017
JDK9 is planning to incrementally support the ES6 features of JavaScript. In the current early-access builds (tested with 9-ea+170), major features like classes are not supported yet; but keywords like let/const, arrow functions and string-interpolation already work:
#!jjs --language=es6
"use strict";

let hello = (from, to) => print(`Hello from ${from} to ${to}`);

if ($EXEC('uname -n')) {
    let hostname = $OUT.trim();
    hello(hostname, 'daniel');
}
For details on what’s included by now, read JEP 292.
AWS ECS: Push a docker container
28 May 2017
Steps to deploy docker containers to AWS EC2:
-
Created a docker-repository with the name
de.dplatz/abc, you will get a page with all the steps and coordinates fordocker login,docker taganddocker push. -
From CLI run:
aws ecr get-login --region eu-central-1
docker tag de.dplatz/abc:latest <my-aws-url>/de.dplatz/abc:latest
docker push <my-aws-url>/de.dplatz/abc:latest
See here for starting the container.
JDK9 HttpClient
20 May 2017
Required some clarification from the JDK team how to access the new HttpClient API (which actually is incubating now):
$ ./jdk-9_168/bin/jshell --add-modules jdk.incubator.httpclient
|  Welcome to JShell -- Version 9-ea
|  For an introduction type: /help intro

jshell> import jdk.incubator.http.*;

jshell> import static jdk.incubator.http.HttpResponse.BodyHandler.*;

jshell> URI uri = new URI("http://openjdk.java.net/projects/jigsaw/");
uri ==> http://openjdk.java.net/projects/jigsaw/

jshell> HttpRequest request = HttpRequest.newBuilder(uri).build();
request ==> http://openjdk.java.net/projects/jigsaw/ GET

jshell> HttpResponse response = HttpClient.newBuilder().build().send(request, discard(null));
response ==> jdk.incubator.http.HttpResponseImpl@133814f

jshell> response.statusCode();
$6 ==> 200
I really like the jshell-integration in Netbeans; unfortunately, it does not allow to set commandline-flags for the started shells yet. Filed an issue and got a workaround for now.
Websphere Liberty Admin Console
12 May 2017
$ bin/installUtility install adminCenter-1.0
server.xml
<!-- Enable features -->
<featureManager>
    <!-- ... -->
    <feature>adminCenter-1.0</feature>
</featureManager>

<keyStore id="defaultKeyStore" password="admin123" />

<basicRegistry id="basic" realm="BasicRealm">
    <user name="admin" password="admin123" />
</basicRegistry>
[AUDIT ] CWWKT0016I: Web application available (default_host): http://localhost:9090/adminCenter/
Docker JVM Memory Settings
01 May 2017
-
JDK9 has
-XX:+UseCGroupMemoryLimitForHeap -
JDK8 pre 131: Always specify
-Xmx1024mand-XX:MaxMetaspaceSize -
JDK8 since 131:
-XX:+UnlockExperimentalVMOptions -XX:+UseCGroupMemoryLimitForHeap
strace
01 May 2017
Read https://blog.packagecloud.io/eng/2017/03/14/using-strace-to-understand-java-performance-improvement/.
strace -fopen,read,close,fstat java -jar Test.jar
Docker Rest API
01 May 2017
SSL keys are at /cygdrive/c/Users/<username>/.docker/machine/machines/default
curl --insecure -v --cert cert.pem --key key.pem -X GET https://192.168.99.100:2376/images/json
Stacktrace in Eclipse Debugger
12 April 2017
How to see the stacktrace for an exception-variable within the eclipse debugger?
Go to Preferences / Java / Debug / Detail Formatter; Add for Throwable:
java.io.Writer stackTrace = new java.io.StringWriter();
java.io.PrintWriter printWriter = new java.io.PrintWriter(stackTrace);
printStackTrace(printWriter);
return getMessage() + "\n" + stackTrace;
Java debug-flags
22 March 2017
-Xdebug
// shared-memory (windows only)
-agentlib:jdwp=transport=dt_shmem,address=eclipse,server=y,suspend=n
// socket
-agentlib:jdwp=transport=dt_socket,server=y,suspend=n,address=9999
inotifywait
07 March 2017
Monitor filesystem-changes:
while inotifywait -qr /dir/to/monitor; do
    rsync -avz /dir/to/monitor/ /dir/to/sync/to
done
List classes in Jar
29 January 2017
List all classes in a jar-file:
$ unzip -l MyJar.jar "*.class" | tail -n+4 | head -n-2 | tr -s ' ' | cut -d ' ' -f5 | tr / . | sed 's/\.class$//'
rsync tricks
20 January 2017
This command removes files that have been removed from the source directory but will not overwrite newer files in the destination:
$ rsync -avu --delete sourcedir/ /cygwin/e/destdir/
To rsync to another system with ssh over the net:
$ rsync -avu --delete -e ssh sourcedir/ username@machine:~/destdir/
Shell Alias-Expansion
17 January 2017
Say, you have defined an alias:
$ alias gg='git log --oneline --decorate --graph'
But when typing 'gg' wouldn’t it be nice to expand the alias so you can make a small modification to the args?
$ gg<Ctrl+Alt+e>
Say, you want to easily clear the screen; there is a shortcut Ctrl+L. But maybe you also always want to print the contents of the current directory: you can rebind the shortcut:
$ bind -x '"\C-l": clear; ls -l'
Java Version Strings
16 January 2017
For what JDK version is a class compiled?
$ javap -verbose MyClass.class | grep "major"
-
Java 5: major version 49
-
Java 6: major version 50
-
Java 7: major version 51
-
Java 8: major version 52
SSH Keys
13 January 2017
To connect to a remote-host without password-entry (for scripting):
# generate ssh keys for local (if not already done)
$ ssh-keygen
$ ssh-copy-id -i ~/.ssh/id_rsa.pub <remote-host>
$ ssh <remote-host>
Maven Fat & Thin Jar
12 January 2017
Building a fat and a thin jar in one go:
<plugin>
    <groupId>org.apache.maven.plugins</groupId>
    <artifactId>maven-shade-plugin</artifactId>
    <version>2.4.3</version>
    <executions>
        <execution>
            <phase>package</phase>
            <goals>
                <goal>shade</goal>
            </goals>
            <configuration>
                <shadedArtifactAttached>true</shadedArtifactAttached>
                <shadedClassifierName>all</shadedClassifierName>
                <transformers>
                    <transformer implementation="org.apache.maven.plugins.shade.resource.ManifestResourceTransformer">
                        <mainClass>com.mycompany.myproduct.Main</mainClass>
                    </transformer>
                </transformers>
            </configuration>
        </execution>
    </executions>
</plugin>
Commandline HTTP-Server
10 January 2017
A very simple http-server:
while true ; do echo -e "HTTP/1.1 200 OK\nAccess-Control-Allow-Origin: *\n\n $(cat index.html)" | nc -l localhost 1500; done
Older posts are available in the archive.